Where are parking lots at least ½ mile away from the Freshman Dormitory?
In this content, the process of creating a map using Geographic Information System (GIS) to identify parking lots at least a mile away from the freshman dormitory is detailed. It explains the use of map layers, spatial information processing, and the GROUP tool to distinguish suitable parking areas. The aim is to discourage freshmen from using cars frequently on campus by strategically locating parking spots.

Download Presentation

Please find below an Image/Link to download the presentation.
The content on the website is provided AS IS for your information and personal use only. It may not be sold, licensed, or shared on other websites without obtaining consent from the author.If you encounter any issues during the download, it is possible that the publisher has removed the file from their server.
You are allowed to download the files provided on this website for personal or commercial use, subject to the condition that they are used lawfully. All files are the property of their respective owners.
The content on the website is provided AS IS for your information and personal use only. It may not be sold, licensed, or shared on other websites without obtaining consent from the author.
E N D
Presentation Transcript
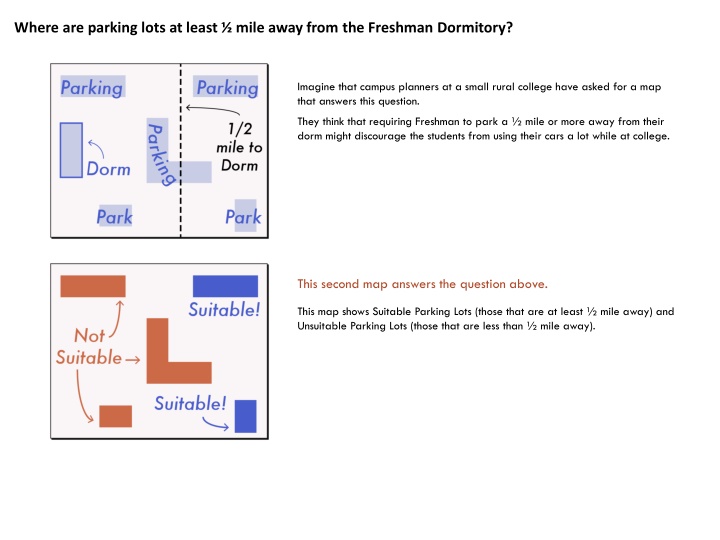
Where are parking lots at least mile away from the Freshman Dormitory? Imagine that campus planners at a small rural college have asked for a map that answers this question. They think that requiring Freshman to park a mile or more away from their dorm might discourage the students from using their cars a lot while at college. This second map answers the question above. This map shows Suitable Parking Lots (those that are at least mile away) and Unsuitable Parking Lots (those that are less than mile away).
Lets look at a procedure to make this map with a Geographic Information System (GIS). Processing spatial information A GIS is a computer program that provides tools for processing spatial information. Each GIS tool takes map layers as inputs and creates new map layers as outputs. Each Tool has a set of rules for how it changes the spatial information on the map. Set of Rules Input Output In our procedure, we will start by working with spatial information that is stored in two separate map layers. Two separate map layers A Parking Layer One Map, Two Themes A Dorm Layer The idea is that rather than using one map about two themes, we will start with two separate layers, each layer concerning one theme. One is a Parking Layer and the other a Dorm Layer.
Heres how a GIS stores map layers as spatial information Can you park cars here? Is this the Freshman Dorm? Both of these maps basically answer yes or no questions: The map on the left addresses the question: Can you park cars here? The map on the right answers the question: Is this the Freshman Dorm? A GIS can represent this spatial information as a set of little squares called Pixels. A set of pixels is called a Raster Layer. Each pixel represents a small area of space defined by the length of the pixel s sides, called the raster s Resolution. A pixel always contains a single numeric Value. In both of our examples, 1 = Yes and 0 = No.
Our first step is to identify separate parking lots with the GROUP tool.
Lets look at how a GIS identifies things as separate groups. Can you park cars here? What is the name of this parking lot? The idea with this step is that we want to take a Layer that tells us, Yes or No, can you park cars here and make a new Layer that tells us What is the name of this parking lot? We can do this with a tool called GROUP. By default, the GROUP tool ignores pixels in the input layer with the value 0 (and won t make groups with them). Ignores pixels with value 0. The output of the GROUP tool is a layer that uniquely identifies separate groups of pixels that have the same value in the input layer. In our example, the tool will identify which pixels with the value 1 in the input should be grouped together in the output. Identifies separate groups with same value in input layer In our case, we used a rule that only groups pixels with the same input value if they share a side. Our Rule: share a side Alternatively, we could define a rule that groups pixels with the same input value if they share a side OR a corner. Alternative Rule: share a side OR a corner Including corners will generally produce fewer groups. In our case, it would produce just one group. Corner Rule = fewer groups.
Our second step is to calculate the distance of every location to the Dormitory with the DISTANCE tool.
Heres how a GIS calculates distance Is this the Dorm? Distance to Dorm In this step, we take our Yes or No, is this a Dorm? Layer and make a new Layer that reports the Distance to the Dorm for every location. This tool is called, conveniently enough, DISTANCE. Distance to nearest pixel that is not 0. The rules for calculating distance are applied automatically and can t be modified. The value of each pixel in the Output will always represent the distance to the nearest pixel that is not 0 in the Input. Layer s Resolution X Number of Rows or Columns away For pixels in the horizontal or vertical direction to the Dorm, the distance is equal to the Layer s Resolution times the number of rows or columns away from the Dorm. For pixels in a diagonal direction to the Dorm, the computer calculates the distance with the Pythagorean theorem, where the distance is the hypotenuse and the other two sides of the triangle are the horizontal and vertical distances. Diagonals calculated with Pythagorean Theorem
Our third step is to calculate the Minimum Distance to the dorm within each Parking Lot with the EXTRACT tool.
Heres how a GIS calculates minimum distance within each separate group For each window, take the minimum distance. Put lots like windows on Distance to Dorm Layer Parking Lot Layer In this step, we want to take our Parking Lot Layer and put the lots like windows on top of the Distance to Dorm Layer. For each window, we can then take the minimum distance value. The tool that does this is called EXTRACT. When we use this tool, we must define three rules. The first rule defines which Layer will serve as the WINDOWS. In our case, this is the Parking Lot Layer. The second rule defines which Layer will serve as the SCENE that we see through the windows. In our case, this is the Distance Layer. The third rule defines the STATISTICAL OPERATOR to apply. In this case, we extracted the Minimum distance value. The layer that serves as WINDOWS. The layer that serves as the SCENE we see through the windows. STATISTICAL OPERATOR is Minimum. Note that 0 Value in the Parking Lot layer also defines a window. Note that the 0 value in the Parking Lot layer also defines a window. In this example, the minimum value in this large window is 0.
Our final step is to classify locations based on our distance criterion using the RECLASS tool.
Heres how a GIS can classify locations Min distance of each lot How lots satisfy our criterion In this step, we want to take the Minimum Distance of each Parking Lot layer and create a new Layer that shows how Parking Lots satisfy our distance criterion (at least mile from the dorm). The tool for this is called RECLASS. Each pixel in the Output receives a new Value that represents whether or not it met our condition and is therefore Suitable for Freshman Parking. In this example, the value 1 means that it is Suitable and the value 2 means it is Not Suitable. The value 0 means that is not a parking lot. When we use this tool, we have to define rules with a RECLASS TABLE. RECLASS TABLE The From To Columns define the range of input values to change. In this example, we need to keep in mind that the units of the Distance raster are in feet and a mile = 2640 feet. From means greater than or equal to and To means less than but not equal to. Range of input values to change New output value < The New Column defines the new output value to give this range. 0 is not in range, so Input pixels with 0 do not change in Output In our example, the value 0 is not in a range to reclassify, so that s why pixels with the value 0 in the Input stay the same in our Output. For the To limit of the second class, we just need a value that is greater than the maximum value in the input, so I just put in a bunch of nines to make a big number. For To limit, need a value that is greater than the maximum value of input
Now lets review our Procedure Third, we found the minimum distance within each unique parking lot with the EXTRACT tool, using the Parking Lot Layer as Windows, the Distance Layer as Scene, and the statistical operator Minimum. First, we grouped together unique parking lots with the GROUP tool, using the Rule of sides but not corners. Sides not Corners Windows Scene Minimum From, To, New Fourth, we classified parking lots as Suitable or Not Suitable with the RECLASS tool, using a RECLASS TABLE that defined ranges of input values and new output values. Second, we found the distance of each location to the dorm with the DISTANCE tool. WELL DONE!