Who Pays the Price? Overdraft Fee Ceilings & Financial Inclusion
The presentation explores the impact of capping overdraft fees on financial inclusion, analyzing the outcomes of selective relaxation of fee caps. It delves into the implications for low-income households, unbanked individuals, and the supply of overdraft credit. Discover insights on the consequences of overdraft pricing and the challenges faced by the unbanked population.
Download Presentation

Please find below an Image/Link to download the presentation.
The content on the website is provided AS IS for your information and personal use only. It may not be sold, licensed, or shared on other websites without obtaining consent from the author.If you encounter any issues during the download, it is possible that the publisher has removed the file from their server.
You are allowed to download the files provided on this website for personal or commercial use, subject to the condition that they are used lawfully. All files are the property of their respective owners.
The content on the website is provided AS IS for your information and personal use only. It may not be sold, licensed, or shared on other websites without obtaining consent from the author.
E N D
Presentation Transcript
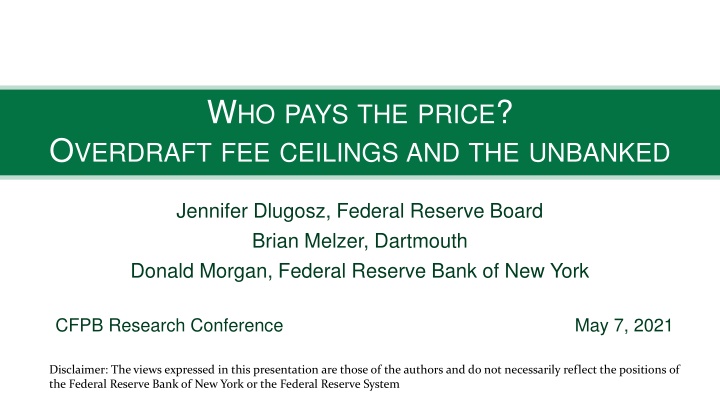
WHO PAYS THE PRICE? OVERDRAFT FEE CEILINGS AND THE UNBANKED Jennifer Dlugosz, Federal Reserve Board Brian Melzer, Dartmouth Donald Morgan, Federal Reserve Bank of New York CFPB Research Conference May 7, 2021 Disclaimer: The views expressed in this presentation are those of the authors and do not necessarily reflect the positions of the Federal Reserve Bank of New York or the Federal Reserve System
Question and Takeaways Would capping overdraft fees promote financial inclusion? Test using selective relaxation of state fee caps in 2001 Find: Unfettered banks raise OD fees but also expand OD credit 1) Returned check rates decline savings on NSF fees 2) More low-income HH banked 3) Conclude that caps reduce overdraft credit supply and financial inclusion Boosting (weak/non-existent) overdraft competition a better way?
Plan 1. Background 2. Study Design/Findings 3. Conclusion
The Unbanked 25% of low-income HH without a checking account Being unbanked is costly: Rely on more expensive alternatives (check cashers, money transfers,etc.) Accumulate less wealth (Celerier and Matray, 2019) Less small dollar credit (payday and overdraft)
Why Unbanked? % FDIC (2019) Half of depositors whose accounts were closed involuntarily ( bounced out ) cite overdrafts as main reason (FDIC 2019) Many reasons but overdraft fees rank high
Background: Overdraft Credit Demand Demand essentially bi-modal - Most depositors rarely/never overdraw; small proportion overdraw almost monthly (CFPB 2013) Depositors must opt-in for overdraft coverage via debit and ATM - Opt-in higher (45%) for heavy uses of OD (CFPB 2013) Depositors that don t repay credit/fees bounce out - Bank closes account and reports to debit bureaus (e.g. Chex systems) - 6.5M accounts closed in 2005 (Campbell et al 2012)
Background: Overdraft Pricing Mean OD fee NSF $30 Bouncing a check especially costly: $60 plus stigma, loss of check- writing privileges
Question: Would Fees Caps Promote Inclusion? Many consumer advocacy groups (Pew, CRL) recommend caps Federal cap proposed in 2019 ( Stop Overdraft Profiteering Act ) overdraft fees push low-income consumers away from banking products altogether (Sen. Cory A. Booker, 2018) Price theory predicts unintended effects: - Overdraft credit is credit per fee - Fee cap credit rationing - Less credit more NSF fees to merchants
Experiment Study effect of fee caps in four states circa 2000 State Alaska Illinois Missouri Tennessee Cap $25 $25 (or actual collection costs) $20 overdraft; $15 NSF $20 Caps relaxed for National Banks by OCC in 2001 Triple difference: National v other banks; limit state v others; pre v post.
Three Main Outcomes 1. Overdraft (fees and availability) 2. Returned checks 3. Unbanked
Overdraft Data Data: Annual telephone survey of bank branch OD pricing and offering by Moebs Services. Cross-section of roughly 600 institutions per year N Mean Std.? Dev. Overdraft? fee All? banks National? banks Other? banks By? time? period 1999-2000 2001-2003 2,936 844 2,092 26.04 27.43 25.48 7.34 6.89 7.44 1,051 1,885 24.95 26.65 7.86 6.96 Overdraft? offered? All? banks National? banks Other? banks By? time? period 1999-2000 2001-2003 3,197 2,270 927 0.91 0.91 0.92 0.28 0.29 0.28 1,133 2,064 0.92 0.91 0.28 0.28 National banks charged higher fees on average
Overdraft Model Triple-diff: ???,?,?,?= ? ?????????,? ?????? ????? Include state and year FE, county, bank, branch controls (including deposit HHI) Estimate over 1999-2003 (avoid broader 2004 exemption) SE clustered by states Assume parallel trend in National State difference in fees limit states
Overdraft Fee Result: Higher Fees OD? Fee 2.58*** (0.73) -1.13 (0.77) -1.12** (0.53) -2.26*** (0.46) OD? Fee 2.54*** (0.66) -0.71 (0.62) -0.70 (0.45) -1.58*** (0.50) OD? Fee 2.25*** (0.56) -0.36 (0.65) -0.03 (0.43) -1.31** (0.51) National? X? Fee? Limit? State? X? Post National? X? Fee? Limit? State National? X? Post Fee? Limit? State? X? Post Observations R-Squared State? and? Year? FE Bank? and? County? Controls 2936 0.033 No No 2936 0.310 Yes No 2394 0.473 Yes Yes Nat l banks increase coverage of OD by 17% relative to mean in fee limit states pre preemption
Overdraft Offered Results: Increased Supply Nat. banks increase coverage of OD by 17% relative to mean after preemption
Overdraft Results: Parallel Trends Nat. banks raise fees roughly 10% relatively after preemption Nat. banks increase coverage of OD by 17% relative to mean after preemption
Returned Checks Data Data from Fed check processing centers (CPC): Checks processed and returned ( bounced ) per quarter Estimate diff-in-diff at CPC level. 46 CPC one per state; 6 in limit states
Returned Checks Data Check Summary Statistics, by State Limit States (N=120) Other States (N = 780) Mean Mean Diff. Log(# processed) 11.36 11.43 -0.07 Log($ processed) 10.99 11.19 -0.20*** # returned (millions) 1.21 1.23 -0.02 $ returned (millions) 9.32 10.32 -1.01 # returned /# processed (%) 1.34 1.16 0.18*** $ returned /$ processed (%) 1.28 1.11 0.16***
Returned Checks Results: Fewer Bounced Checks Dependent? variable: Post? X? Fee? Limit? State Log(#? Processed) 0.05** (0.02) 0.78** (0.32) 0.01 (0.01) 0.58* (0.31) 11.42 0.98 900 Yes Yes Yes Log($? Processed) 0.07 (0.05) 0.72* (0.39) 0.01 (0.02) 0.17 (0.64) 11.17 0.98 900 Yes Yes Yes ? %? ? Returned? (#) -0.15*** (0.04) 0.88 (1.32) -0.01 (0.02) 0.26 (1.49) 1.18 0.71 900 Yes Yes Yes ? %? Returned? $) -0.22*** (0.07) ? 1.05 (1.22) -0.01 (0.03) -0.07 (1.35) 1.14 0.73 900 Yes Yes Yes Income Unemployment Log(Population) Outcome? mean R^2 Observations Year? X? Quarter? FE CPC? FE County? controls -0.22 15% decline relative to mean in limit states Substantial potential savings in NSF fees to merchants
Banked Data SIPP: Quarterly survey (roughly) on HH checking account ownership Full? Sample Income? in? Bottom? Quintile Mean Std.? Dev. Mean Std.? Dev. Income? and? Finances Checking? account?? (%) Income? (annualized,? $? thousands) Net? worth? ($? millions Race/Ethnicity? (%) White Black Hispanic Asian Other Education? (%) Less? than? HS? diploma HS? diploma Some? college College? degree Graduate? degree Age 66.0 47.4 43.8 49.6 51,886.2 171,816.2 51,599.1 1,169,222.0 8,924.1 82,569.1 7,928.7 1,081,444.0 74.6 12.2 8.9 3.2 1.1 43.6 32.8 28.5 17.7 10.2 65.4 20.2 10.4 2.6 1.4 47.6 40.1 30.5 15.9 11.6 15.5 28.9 26.1 20.2 9.3 49.2 36.2 45.3 43.9 40.2 29.0 16.9 33.4 33.1 21.5 9.3 2.8 54.8 47.2 47.0 41.1 29.0 16.4 20.2
Banked Results: Increased Inclusion Dependent? Variable:? Indicator? for? Checking? Account? Fee? limit? x? Post 5.2** (2.1) -0.6 (3.7) -2.5** (1.0) 5.5** (2.5) 5.0*** (1.5) 4.8*** (1.7) Fee? limit Post Banking? deregulation? index 1.3 (1.9) N R2 20,746 0.00 20,746 0.03 20,740 0.16 20,740 0.16 State? fixed? effects? Year-month? fixed? effects? Household? controls? N N N Y Y N Y Y Y Y Y Y 4.8 p.p. increase in banked low-income HH 11% of mean in limit states Effect only evident for low income HH (bottom quintile)
Banked: Behavioral Concerns Newly banked not necessarily better off if fees shrouded (Gabaix and Laibson 2006) Na ve depositors open/re-open account but later have it closed after a rash of overdrafts/returned checks Lower returned check rates suggest otherwise Also find lower account turnover and enduring relationships
Banked Result: Less Turnover Dependent? Variable Gained? Checking? Account Lost? Checking? Account Fee? limit? x? Post 2.1*** (0.7) -1.5* (0.8) N R2 12,427 0.01 12,427 0.01 State? fixed? effects? Year-month? fixed? effects? Household? and? state? controls? Y Y Y Y Y Y Low income HH less likely to lose account & more likely to gain after preemption.
Banked Result: Enduring Relationships Largest effect at sample end Es mated? Impact? of? Fee? Limit? on? Account? Ownership? Over? Time? 15? 10? 5? 0? 2000Q1? 2001Q1? 2002Q1? 2003Q1? 1999Q4? 2000Q2? 2000Q3? 2000Q4? 2001Q2? 2001Q3? 2001Q4? 2002Q2? 2002Q3? 2002Q4? 2003Q2? 2003Q3? 2003Q4? -5? -10?
Recap Fee caps lower OD fees but less OD credit 1) Higher returned checks rates under caps less OD credit (and $$$ in NSF) 2) Low income HH less likely banked with cap 3)
Conclusion Urge to curb high overdraft fees understandable but beware Ec:101: caps reduce overdraft credit, so more bounces checks and less financial exclusion Banked depositors pay $$$ in returned check fees that might have been covered absent cap Increasing competition may be better path to increased inclusion
Competition Instead of Caps? Overdraft very profitable to banks and credit unions ($35 bn annually) Competition weak among depositories (no advertising!) But works across small dollar lenders (Melzer and Morgan 2004)
Contribution Financial Inclusion. Campbell, Martinez-Jerez, Tufano (2012), Celerier and Matray (2019), Dupas, Karlan, Robinson, Ubfal (2018), Bord (2020). Behavioral economics/consumer financial regulation. Gabaix and Laibson (2006), Mullainathan, Barr, and Shafir (2009), Heidhues and Koszegi (2018), Alan, Cemalcilar, Karlan, Zinman (2018), Stango and Zinman (2011, 2014), Ru and Schoar (2019), Melzer and Morgan (2005) Price ceilings in banking.Agarwal, Chomsisengphet, Mahoney, Stroebel (2014), Nelson (2018), Kay, Manuszak, Vojtech (2017)); Knittel and Stango (2003), DeYoung and Phillips (2009), Melzer and Schroeder (2018).
OCC preemption OCC historically preempts state fee and usury limits for National banks Before 2001, OCC had granted only qualified exemption from state overdraft fee limits; evaluated case-by-case OCC removed qualification in July 2001 and categorically exempted national banks from state limits Natural experiment: only national banks exempted, only some states limited
Banked Results: Only Low-income HH Affected Dependent? Variable:? Checking? Account? Income Quintile? 1 Income Quintile? 2 Income Quintile? 3 Income Quintile? 4 Income Quintile? 5 Full Sample Sample: Fee? limit? x? Post 4.8*** (1.7) -1.5 (2.4) 2.4 (4.3) 1.9 (2.5) -0.8 (1.4) 0.8 (2.4) 4.0*** (1.4) Fee? limit? x? Post? x? Income? Bottom? Quintile N R2 20,740 0.16 20,560 0.13 20,451 0.08 21,381 0.06 23,251 0.05 106,383 0.16 State? fixed? effects? Year-month? fixed? effects? Household? and? state? controls? Y Y Y Y Y Y Y Y Y Y Y Y Y Y Y Y Y Y
