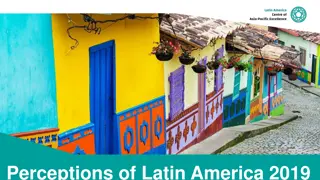
Wind and Solar in Latin America: Recent Trends and Challenges
Discussing the recent trends in wind and solar power capacity in Latin America, including policy drivers, challenges, and room for development. While wind power shows strong momentum, solar power lags behind with weak growth over the years.

Download Presentation

Please find below an Image/Link to download the presentation.
The content on the website is provided AS IS for your information and personal use only. It may not be sold, licensed, or shared on other websites without obtaining consent from the author.If you encounter any issues during the download, it is possible that the publisher has removed the file from their server.
You are allowed to download the files provided on this website for personal or commercial use, subject to the condition that they are used lawfully. All files are the property of their respective owners.
The content on the website is provided AS IS for your information and personal use only. It may not be sold, licensed, or shared on other websites without obtaining consent from the author.
E N D
Presentation Transcript
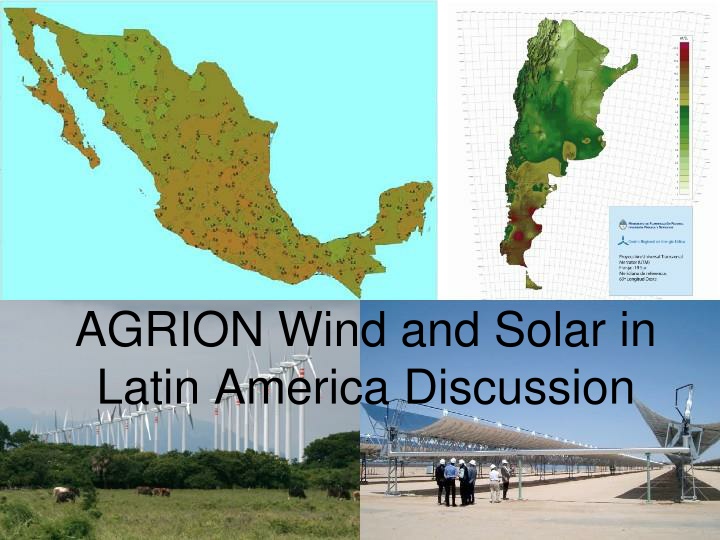
AGRION Wind and Solar in Latin America Discussion
Outline Recent Trends and Resource Potential for wind and solar in Latin America Policy drivers and policy landscape Challenges going forward
Recent Trends: lots of momentum for wind power Latin America Installed Wind Power Capacity `97-`10 3000 2500 2000 Other S. & C. America Argentina Costa Rica Mexico Brazil MW 1500 1000 500 0 1997 1998 1999 2000 2001 2002 2003 2004 2005 2006 2007 2008 2009 2010 Source: BP Statistical Review of World Energy June 2011
Recent Trends: lots of momentum for wind power Installed Wind Capacity: Yearly Growth 160% 140% 120% Total Latin America Germany US India China 100% 80% 60% 40% 20% 0% 1997 1998 1999 2000 2001 2002 2003 2004 2005 2006 2007 2008 2009 2010 Source: BP Statistical Review of World Energy June 2011
Recent Trends: room for more development of wind capacity Source: GWEC 2010 Global Wind 2010 Report
Recent Trends: weak momentum for solar Installed Solar Power Capacity, 1996-2010 35000 30000 25000 Germany Spain Japan Italy US Mexico All Latin America 20000 MW 15000 10000 5000 200 0 1996 1997 1998 1999 2000 2001 2002 2003 2004 2005 2006 2007 2008 2009 2010 Source: BP Statistical Review of World Energy June 2011, EPIA Report September 2010
Recent Trends: weak momentum for solar Installed Solar Power Capacity, 1996-2010 10000 9000 8000 Germany Spain Japan Italy US Mexico All Latin America 7000 6000 MW 5000 4000 3000 2000 1000 200 0 1996 1997 1998 1999 2000 2001 2002 2003 2004 2005 2006 2007 2008 2009 2010 Source: BP Statistical Review of World Energy June 2011, EPIA Report September 2010
Recent Trends: weak momentum for solar Installed Solar Power Capacity, 1996-2010 1000 900 800 Germany Spain Japan Italy US Mexico All Latin America 700 600 MW 500 400 300 200 200 100 0 1996 1997 1998 1999 2000 2001 2002 2003 2004 2005 2006 2007 2008 2009 2010 Source: BP Statistical Review of World Energy June 2011, EPIA Report September 2010
Recent Trends: weak momentum for solar Installed Solar Power Capacity, 1996-2010 500 450 400 Germany Spain Japan Italy US Mexico All Latin America 350 300 MW 250 200 200 150 100 50 0 1996 1997 1998 1999 2000 2001 2002 2003 2004 2005 2006 2007 2008 2009 2010 Source: BP Statistical Review of World Energy June 2011, EPIA Report September 2010
Recent Trends: weak momentum for solar Installed Solar Power Capacity, 1996-2010 100 90 80 Germany Spain Japan Italy US Mexico All Latin America 70 60 MW 50 40 30 20 10 0 1996 1997 1998 1999 2000 2001 2002 2003 2004 2005 2006 2007 2008 2009 2010 Source: BP Statistical Review of World Energy June 2011, EPIA Report September 2010
Recent Trends: weak momentum for solar (but Mexico leads) Source: EPIA Report September 2010
Resource Potential: Excellent wind potential Source: 3Tier , Free copy available here
Resource Potential: Excellent solar potential Latin America Source: http://solarcooking.wikia.com
Resource Potential: Argentina Wind/Solar Potential Wind: Solar: Source: Meisen and Krumpel, Renewable Energy Potential of Latin America 2009
Resource Potential: Brazil Wind/Solar Potential Wind Intensity: Solar Intensity: Source: Meisen and Krumpel, Renewable Energy Potential of Latin America 2009
Resource Potential: Brazil Wind/Solar Potential Wind and solar: Piaui, Bahia, Minas Gerais Wind Intensity: Solar Intensity: Source: Meisen and Krumpel, Renewable Energy Potential of Latin America 2009
Resource Potential: Mexico Solar Potential Sonoran Desert Source: Meisen and Krumpel, Renewable Energy Potential of Latin America 2009
Some context: Desertec Initiative Immense solar potential that exists in a desert Deserts and ecological questions The need for scaled CSP www.desertec.org/
Resource Potential: Mexico Wind Potential Source: Meisen and Krumpel, Renewable Energy Potential of Latin America 2009
Policy drivers Energy security Declining costs of renewable energy, especially solar
Policy Drivers: Energy security and the downsides of hydropower Brazilian drought in summer 2001, lack of hydro-reserves Source: Center for Energy Economics Brazil s Power Market Crisis 2002
Policy Drivers: Energy security and volatility of natural gas prices Natural Gas Prices: Composite EU/UK/US/Canada Index (2010 dollars) Dollars per MMBTU $12 $10 $8 $6 $4 $2 $0 1996 1998 2000 2002 2004 2006 2008 2010 Source: BP Statistical Review of World Energy June 2011
Policy Drivers: Recent declining costs of wind power Link: http://eetd.lbl.gov/ea/ems/reports/lbnl-5119e.pdf
Policy Drivers: Declining costs of PV solar power Source: OpenPV NREL Database
Policy Drivers: Declining costs of solar overall Source: Greentech Media Research: Concentrating Solar Power 2011: Technology, Costs and Markets
Policy Landscape: Renewables policies Regulatory policies Feed-in tariff Renewable Portfolio Standard (RPS) (Utility quota obligation) Tradable renewable energy certificate (RECs) Fiscal incentives Tax incentives Conditional grants Public financing Public loans, public competitive bidding
Source: REN21 2010 Global Status Report QuickTime and a decompressor are needed to see this picture. QuickTime and a decompressor are needed to see this picture. QuickTime and a decompressor are needed to see this picture. Highlighted countries received highest scores on World Bank governance and rule of law indices. QuickTime and a decompressor are needed to see this picture.
Policy Landscape: Regional Partnerships Sistema de Interconexi n El ctrica de los Pa ses de Am rica Central (SIEPAC)
Policy Landscape: Regional Partnerships MERCOSUR: Uruguayan initiatives to integrate the production of renewable energy Links: http://www.rechargenews.com/energy/wind/article287636.ece, http://en.mercopress.com/2011/06/29/argentina-asks-mercosur-to-draft-an-industrial-policy-and-contain-asian-imports
Challenges End of the CDM as Kyoto period expires in 2012 Centralizing all policy information related to the region into one database Fostering more meaningful regional integration and coordination
Global Energy Network Institute (GENI) http://www.geni.org/ 1-619-595-0139 Peter Meisen, Founder and President Derek Urmston, Research Associate


")