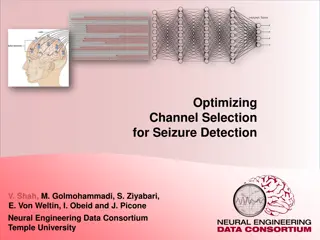
Wireless Channel Models and Fading Effects
Explore the dynamics of wireless channels, signal losses, and fading effects including large scale, medium scale, and small scale fading. Learn about path loss, shadowing, and self-interference in UHF and SHF bands. Discover the impact of multipath propagation and empirical models for propagation losses in different environments.

Download Presentation

Please find below an Image/Link to download the presentation.
The content on the website is provided AS IS for your information and personal use only. It may not be sold, licensed, or shared on other websites without obtaining consent from the author. If you encounter any issues during the download, it is possible that the publisher has removed the file from their server.
You are allowed to download the files provided on this website for personal or commercial use, subject to the condition that they are used lawfully. All files are the property of their respective owners.
The content on the website is provided AS IS for your information and personal use only. It may not be sold, licensed, or shared on other websites without obtaining consent from the author.
E N D
Presentation Transcript
Signal Losses due to three Effects: 2. Medium Scale Fading: due to shadowing and obstacles 3. Small Scale Fading: due to multipath 1. Large Scale Fading: due to distance
Wireless Channel Frequencies of Interest: in the UHF (.3GHz 3GHz) and SHF (3GHz 30 GHz) bands; Several Effects: Path Loss due to dissipation of energy: it depends on distance only Shadowing due to obstacles such as buildings, trees, walls. Is caused by absorption, reflection, scattering Self-Interference due to Multipath. P 10 log rec 10 transm P log10 distance
1.1. Large Scale Fading: Free Space Path Loss due to Free Space Propagation: For isotropic antennas: Transmit antenna 2 = P transm P Receive antenna rec 4 d d c F = wavelength Path Loss in dB: transm P P = = + + 10log 20log ( ( )) 20log ( ( )) 32.45 L F MHz d km 10 10 10 rec
2. Medium Scale Fading: Losses due to Buildings, Trees, Hills, Walls The Power Loss in dB is random: p L = + L E p expected value random, zero mean approximately gaussian with 6 12 dB
Average Loss Free space loss at reference distance d = + { } 10 log E L L dB 10 0 p d 0 Reference distance Path loss exponent indoor 1-10m outdoor 10-100m E L L 10 Values for Exponent : 0 p Free Space 2 20dB Urban 2.7-3.5 Indoors (LOS) 1.6-1.8 10 10 2 1 0 log ( / ) d d 10 10 10 0 Indoors(NLOS) 4-6
Empirical Models for Propagation Losses to Environment Okumura: urban macrocells 1-100km, frequencies 0.15-1.5GHz, BS antenna 30-100m high; Hata: similar to Okumura, but simplified COST 231: Hata model extended by European study to 2GHz
3. Small Scale Fading due to Multipath. a. Spreading in Time: different paths have different lengths; Receive Transmit = = + ) ... + ( ) x t ( ) t t ( ) y t ( h t t 0 k k 0 1 2 3 0t time 0t Example for 100m path difference we have a time delay 2 100 c 10 = = = sec 1 3 8 3 10
Typical values channel time spread: = ( ) x t ( ) t t 0 1 2 0t MAX 0t channel Indoor 10 50 sec Suburbs 2 10 Urban 1 3 Hilly 3-10 sec n 1 2 sec sec
b. Spreading in Frequency: motion causes frequency shift (Doppler) = 2 j F t ( ) x t X e c Receive Transmit T ( ) + 2 j F F t = ( ) y t Y e c R time v time for each path Doppler Shift + c F F cf Frequency (Hz)
Put everything together Transmit Receive (t ) (t ) x y time v rmc-002 time
(t ) w channel ( ) x t ( ) y t (t ) h (t ) (t ) gT gR Re{.} LPF LPF 2 2 j F t j F t e e C C shift in time Each path has attenuation 2 ( + = )( ) j F F t ( ) y t Re ( ) ( ) a t x t e c paths shift in frequency (this causes small scale time variations)
2.1 Statistical Models of Fading Channels Several Reflectors: ( ) x t ( ) y t t 1 Transmit 2 t v
For each path with NO Line Of Sight (NOLOS): ( ) y t average time delay t v cos( ) v + each time delay k F F each doppler shift D t 2 ( + = )( ) j F F t ( ) Re ( ) y t a e x t c k k k k
Some mathematical manipulation 2 ( + + = )( ) 2 2 j F F j F t j F t ( ) Re ( ) y t a e e x t e c k c k k k ( ) 2 ( + + ) j F F = 2 j F t ( ) ( ) r t a e e x t c k k k k / 1 Assume: bandwidth of signal << ( ) r t e x t ( ) x t ( ) k leading to this: = 2 j F t ( ) Re y t c = ( ) ( c t x t ( ) ) r t = ( ) 2 ( + + ) j F F 2 j F t ( ) c t a e e c k with random, time varying k k
Statistical Model for the time varying coefficients M = ( ) 2 ( + + ) j F F 2 j F t ( ) c t a e e c k k = 1 k random By the CLT is gaussian, zero mean, with: ( ) c t + = * ( ) ( ) (2 ) E c t c t t PJ F t 0 D v c v = = with the Doppler frequency shift. F F D C
Each coefficient is complex, gaussian, WSS with autocorrelation ( ) c t + = * ( ) ( ) (2 ) E c t c t t PJ F t 0 D and PSD 2 F 1 if | | F F D = = 1 ( 2 ( ) S F (2 ) FT J F t / ) F F D 0 D D 0 otherwise with maximum Doppler frequency. D F ( ) S F This is called Jakes spectrum. F F D
Bottom Line. This: (t ) (t ) x y time time v rmc-002 1 time N can be modeled as: 1 1( ) c t ( ) y t (t ) x ( ) c t time time N ( ) t N c delays
For each path = ( ) ( ) c t P c t unit power time invariant time varying (from autocorrelation) from power distribution
Parameters for a Multipath Channel (No Line of Sight): P P Time delays: Power Attenuations: sec 1 2 L L P dB 1 2 F Hz Doppler Shift: D Summary of Channel Model: = = ( ) ( ) ( ) y t c t x t ( ) ( ) c t P c t (t ) c WSS with Jakes PSD
Non Line of Sight (NOLOS) and Line of Sight (LOS) Fading Channels { E = ( )} 0 c t 1. Rayleigh (No Line of Sight). Specified by: = [ , ,..., ] T Time delays 1 2 N P = [ , ,..., ] P P P Power distribution 1 2 N F Maximum Doppler D { ( )} 0 E c t 2. Ricean (Line of Sight) K Same as Rayleigh, plus Ricean Factor K + =1 LOS P Total P Power through LOS K 1 =1 NOLOS P Total P Power through NOLOS + K
Simulink Example M-QAM Modulation Rayleigh Fading Channel Parameters Bernoulli Binary Rectangular QAM -K- Channel Attenuation Transmitter Gain -K- Bernoulli Binary Generator Rectangular QAM Modulator Baseband Multipath Rayleigh Fading Channel Rayleigh Fading -K- B-FFT Receiver Gain Spectrum Scope Bit Rate
Set Numerical Values: velocity carrier freq. v F = F Recall the Doppler Frequency: D C c 8m 3 10 / sec ( ) ( ) v ( )GHz F F Easy to show that: / D C km h Hz modulation power channel
Channel Parameterization 1. Time Spread and Frequency Coherence Bandwidth 2. Flat Fading vs Frequency Selective Fading 3. Doppler Frequency Spread and Time Coherence 4. Slow Fading vs Fast Fading
1. Time Spread and Frequency Coherence Bandwidth (t ) p Try a number ofexperiments transmitting a narrow pulse at different random times ) ( t x = ( ) p t it We obtain a number of received pulses = + ( ) ( ) ( c t p t ) ( ) ( p t ) y t t c t t i i i i t 1t 2 ( i c t 1 0 + ) transmitted 2 2 + ( ) c it 1 1 + ( ) c t i t t 2 1 i 0 t t 2 1 N 0
= t t Take the average received power at time i 1P 2P = P 2| ) t | ( P E c 2 1 0 More realistically: Received Power 0 10 20 time RMS MEAN
This defines the Coherence Bandwidth. (t ) x F Take a complex exponential signal with frequency . The response of the channel is: = 2 ( ) je F t ( ) ( ) y t c t MEAN MEAN = 2 ( ) j F t ( ) y t ( ) c t e | | 1 F If then RMS i.e. the attenuation is not frequency dependent Define the Frequency Coherence Bandwidth as 1 = B c 5 RMS
This means that the frequency response of the channel is flat within the coherence bandwidth: Channel Flat up to the Coherence Bandwidth frequency 1 = B Coherence Bandwidth c 5 RMS Flat Fading Just attenuation, no distortion < > Signal Bandwidth Frequency Coherence Frequency Selective Fading Distortion!!!
Example: Flat Fading Channel : Delays T=[0 10e-6 15e-6] sec Power P=[0, -3, -8] dB Symbol Rate Fs=10kHz Doppler Fd=0.1Hz Modulation QPSK Very low Inter Symbol Interference (ISI) Spectrum: fairly uniform
Example: Frequency Selective Fading Channel : Delays T=[0 10e-6 15e-6] sec Power P=[0, -3, -8] dB Symbol Rate Fs=1MHz Doppler Fd=0.1Hz Modulation QPSK Very high ISI Spectrum with deep variations
3. Doppler Frequency Spread and Time Coherence Back to the experiment of sending pulses. Take autocorrelations: t 1t 2 ( i c t 1 0 + transmitted ) 2 2 + ( ) c it 1 1 + ( ) c t i t t 2 1 i 0 t t 2 1 N 0 t 2( ) R Where: ) t ( t ) R t 1( ) R = + * ( ) ( ) ( R t E c t c t
Take the FT of each one: ( ) S F F F D (t ) c This shows how the multipath characteristics change with time. It defines the Time Coherence: 9 T C 16 F D Within the Time Coherence the channel can be considered Time Invariant.
Summary of Time/Frequency spread of the channel Frequency Spread ( F t , ) S Time F Coherence F 9 D T t Time Spread mean C 16 F D RMS Frequency Coherence 1 = B c 5 RMS
Stanford University Interim (SUI) Channel Models Extension of Work done at AT&T Wireless and Erceg etal. Three terrain types: Category A: Hilly/Moderate to Heavy Tree density; Category B: Hilly/ Light Tree density or Flat/Moderate to Heavy Tree density Category C: Flat/Light Tree density Six different Scenarios (SUI-1 SUI-6). Found in IEEE 802.16.3c-01/29r4, Channel Models for Wireless Applications, http://wirelessman.org/tg3/contrib/802163c-01_29r4.pdf V. Erceg etal, An Empirical Based Path Loss Model for Wireless Channels in Suburban Environments, IEEE Selected Areas in Communications, Vol 17, no 7, July 1999


:")


:")
 and Line of Sight (LOS) Fading")


 Channel Models")