Wireshark's Advanced Features
Uncover the advanced features of Wireshark, including Protocol Hierarchy, Conversations, Endpoints, Graphs, and Expert Infos. Dive into the details of the Protocol Hierarchy window for insights on protocol distribution, detect unusual network activities, and identify active devices through Conversations. Understand how endpoints communicate and the significance of capturing file details, timestamps, interfaces, and display filters in Wireshark's summary dialog.

Download Presentation

Please find below an Image/Link to download the presentation.
The content on the website is provided AS IS for your information and personal use only. It may not be sold, licensed, or shared on other websites without obtaining consent from the author.If you encounter any issues during the download, it is possible that the publisher has removed the file from their server.
You are allowed to download the files provided on this website for personal or commercial use, subject to the condition that they are used lawfully. All files are the property of their respective owners.
The content on the website is provided AS IS for your information and personal use only. It may not be sold, licensed, or shared on other websites without obtaining consent from the author.
E N D
Presentation Transcript
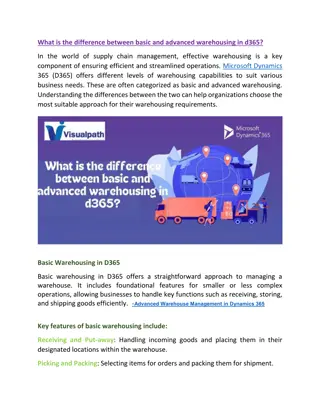
Advance Features of Wireshark
Contents Static Menu Protocol Hierarchy Conversation Endpoints Graphs Expert Infos
Summary Dialog File: General information, such as the name of the file, location of the file, format used, and encapsulation, is listed under this Time: This section will tell you the time when the first and the last packets were captured and the time elapsed (total capture duration) Capture: This lists the name of the OS along with the version used and the interface used to dump packets from the live network traffic Comments: This shows any comments that the user mentioned for reference Interface(s): This lists the details of every interface, using which the traffic is captured Display: This section gives statistics regarding any display filter that has been used and the percentage of ignored packets after a filter was applied
Protocol Hierarchy The Protocol Hierarchy window provides us with an overview regarding distribution of protocols used in the communication process and how to spot unusual activities in your network that do not follow the benchmark as expected.
Conversations When two devices are connected on the network, they are supposed to communicate; this is considered normal behavior. However, suppose you have thousands of devices connected to your network and you want to figure out the most active device that is generating too much traffic, then in that instance, the Conversations window will be quite useful.
Endpoints Two devices that share data with each other are often referred to as endpoints with reference to Wireshark. As we have noticed and observed, if a host intends to talk to another host on the network, they would require some form of address to send and receive packets yes, I am talking about the physical address that every device holds.
Graphs Name Filter Color Style X-Axis Y-Axis Intervals
Expert Information Red: This indicates errors Yellow: This refers to warnings Cyan: This refers to a note Blue: This refers to chats Green: This refers to comments Grey: This means non
Practical Questions Q.1. Create a display filter for FTP packets, and apply the same in a Flow graph. Then, customize it to check the SEQ number and ACKs instead of details. Q.2. Using a previously captured file, create a Round Time Trip graph and figure out the packet whose RTT is the highest. Then, check the sequence number of that packet and verify its sequence number by comparing it with the graph. Q.3. Create a Throughput graph between a server and your client. Try to figure out at what time the throughput was at its peak and also try to check the average throughput in bytes/seconds. Q.4. If you have a requirement to view TCP packets in a raw data form, then which option will you opt for to customize the same window in order to view just the responses from the server side? Q.5. Create an IO graph and show UDP traffic in red along with general TCP traffic. Then, change the y axis unit to per bytes