Wisconsin 2024 School Health Profiles Report Weighted Principal Survey Results
Explore the percentage of schools in Wisconsin that have used self-assessment tools to assess various health-related areas, activities conducted, and groups offering guidance on health topics. Dive into the specifics of school health policies and programs in different categories such as physical education, nutrition, tobacco & drug-use prevention, chronic health conditions, safety, sexual health, and more.

Download Presentation

Please find below an Image/Link to download the presentation.
The content on the website is provided AS IS for your information and personal use only. It may not be sold, licensed, or shared on other websites without obtaining consent from the author. If you encounter any issues during the download, it is possible that the publisher has removed the file from their server.
You are allowed to download the files provided on this website for personal or commercial use, subject to the condition that they are used lawfully. All files are the property of their respective owners.
The content on the website is provided AS IS for your information and personal use only. It may not be sold, licensed, or shared on other websites without obtaining consent from the author.
E N D
Presentation Transcript
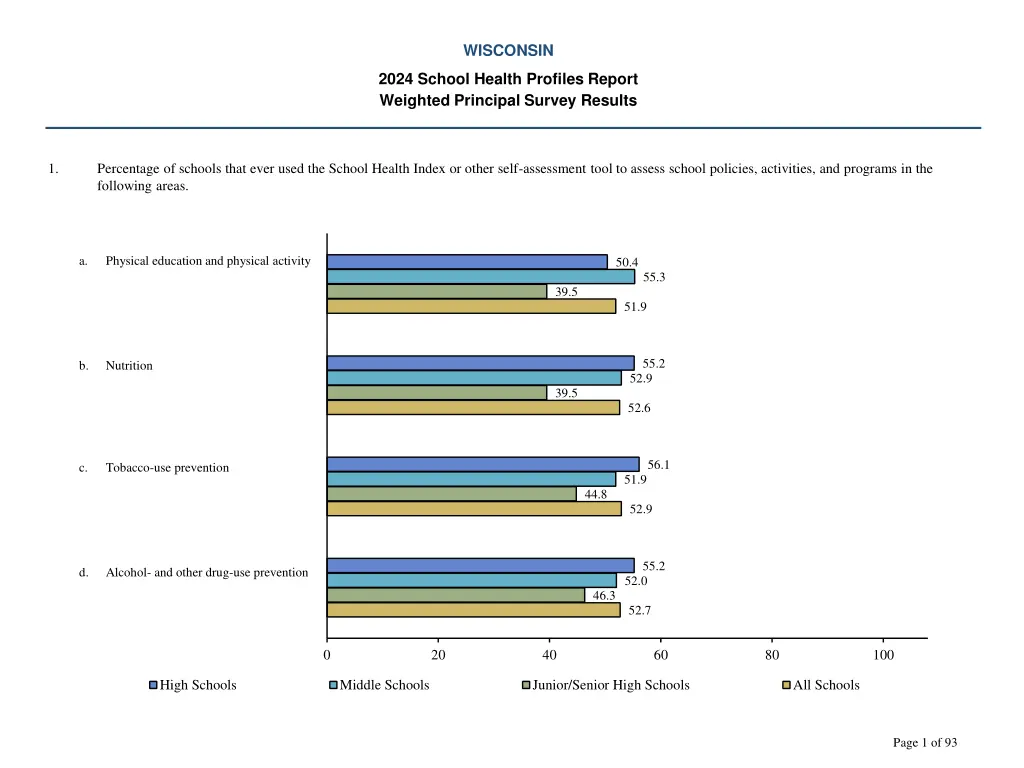
WISCONSIN 2024 School Health Profiles Report Weighted Principal Survey Results 1. Percentage of schools that ever used the School Health Index or other self-assessment tool to assess school policies, activities, and programs in the following areas. a. Physical education and physical activity 50.4 55.3 39.5 51.9 55.2 b. Nutrition 52.9 39.5 52.6 56.1 c. Tobacco-use prevention 51.9 44.8 52.9 55.2 d. Alcohol- and other drug-use prevention 52.0 46.3 52.7 0 20 40 60 80 100 High Schools Middle Schools Junior/Senior High Schools All Schools Page 1 of 93
WISCONSIN 2024 School Health Profiles Report Weighted Principal Survey Results 1. Percentage of schools that ever used the School Health Index or other self-assessment tool to assess school policies, activities, and programs in the following areas. 42.8 e. Chronic health conditions (e.g., asthma, food allergies) 42.3 19.0 40.3 43.3 46.3 f. Unintentional injury and violence prevention (safety) 33.8 43.9 48.5 48.1 g. Sexual health, including HIV, other sexually transmitted infection (STI), and pregnancy prevention 36.5 47.2 0 20 40 60 80 100 High Schools Middle Schools Junior/Senior High Schools All Schools Page 2 of 93
WISCONSIN 2024 School Health Profiles Report Weighted Principal Survey Results 2. Percentage of schools that did the following activities during the past year. a. Reviewed district s local wellness policy 86.1 88.2 76.7 86.2 63.6 b. Helped revise district s local wellness policy 67.4 53.9 64.6 79.9 c. Communicated to school staff about district s local wellness policy 83.0 71.7 80.6 68.9 d. Communicated to parents and families about district s local wellness policy 73.5 65.5 70.9 0 20 40 60 80 100 High Schools Middle Schools Junior/Senior High Schools All Schools Page 3 of 93
WISCONSIN 2024 School Health Profiles Report Weighted Principal Survey Results 2. Percentage of schools that did the following activities during the past year. 65.6 e. Communicated to students about district s local wellness policy 66.1 62.9 65.6 63.0 65.2 f. Measured school s compliance with district s local wellness policy 68.4 64.7 52.0 54.9 g. Developed an action plan that describes steps to meet requirements of district s local wellness policy 39.0 52.2 0 20 40 60 80 100 High Schools Middle Schools Junior/Senior High Schools All Schools Page 4 of 93
WISCONSIN 2024 School Health Profiles Report Weighted Principal Survey Results 3. Percentage of schools that have one or more than one group (e.g., school health council, committee, team) that offers guidance on the development of policies or coordinates activities on health topics. 65.7 57.2 65.1 61.4 0 20 40 60 80 100 High Schools Middle Schools Junior/Senior High Schools All Schools Page 5 of 93
WISCONSIN 2024 School Health Profiles Report Weighted Principal Survey Results 4. Percentage of schools that have a school health council, committee, or team that did the following activities during the past year.* a. Identified student health needs based on a review of relevant data 86.4 76.8 68.0 80.1 82.4 b. Used district or school data to improve diversity, equity, inclusion, or accessibility (e.g., staffing, professional development, curriculum) 82.0 80.0 82.0 74.2 c. Recommended new or revised health and safety policies and activities to school administrators or the school improvement team 80.8 73.3 77.2 80.2 d. Sought funding or leveraged resources to support health and safety priorities for students and staff 67.6 77.1 74.0 0 20 40 60 80 100 High Schools Middle Schools Junior/Senior High Schools All Schools *Among schools that have one or more than one group that offers guidance on the development of policies or coordinates activities on health topics. Page 6 of 93
WISCONSIN 2024 School Health Profiles Report Weighted Principal Survey Results 4. Percentage of schools that have a school health council, committee, or team that did the following activities during the past year.* 88.7 e. Communicated the importance of health and safety policies and activities to district administrators, school administrators, parent-teacher groups, or community members 86.4 76.3 86.4 85.3 86.1 f. Reviewed health-related curricula or instructional materials 69.2 84.0 88.6 90.3 g. Provided input on or reviewed the school s Emergency Operations Plan (EOP) or similar plan 94.9 90.0 0 20 40 60 80 100 High Schools Middle Schools Junior/Senior High Schools All Schools *Among schools that have one or more than one group that offers guidance on the development of policies or coordinates activities on health topics. Page 7 of 93
WISCONSIN 2024 School Health Profiles Report Weighted Principal Survey Results 5. Percentage of schools that use the following types of security staff during the regular school day. 22.9 a. Security guards (private or school employees/contractors) 17.2 6.0 18.4 59.2 57.2 b. School resource officers (SROs) 48.5 57.2 26.3 21.5 c. Police officers other than SROs (i.e., county or local law enforcement) 23.1 23.7 0 20 40 60 80 100 High Schools Middle Schools Junior/Senior High Schools All Schools Page 8 of 93
WISCONSIN 2024 School Health Profiles Report Weighted Principal Survey Results 6. Percentage of schools that have taken any of the following actions related to before- or after-school programs. 39.4 a. Included before- or after-school settings as part of the School Improvement Plan 54.3 36.1 46.6 42.6 43.7 b. Encouraged before- or after-school program staff or leaders to participate in school health council, committee, or team meetings 32.5 42.3 42.9 55.5 c. Partnered with community-based organizations (e.g., Boys & Girls Clubs, YMCA, 4H Clubs) to provide students with before- or after-school programming 26.5 47.7 0 20 40 60 80 100 High Schools Middle Schools Junior/Senior High Schools All Schools Page 9 of 93
WISCONSIN 2024 School Health Profiles Report Weighted Principal Survey Results 7. Percentage of schools that have a student-led club that aims to create a safe, welcoming, and accepting school environment for all youth, regardless of sexual orientation or gender identity. These clubs sometimes are called Gay/Straight Alliances or Genders and Sexualities Alliances (GSAs). 67.3 51.4 54.4 58.1 0 20 40 60 80 100 High Schools Middle Schools Junior/Senior High Schools All Schools Page 10 of 93
WISCONSIN 2024 School Health Profiles Report Weighted Principal Survey Results 8. Percentage of schools that engage in the following practices related to lesbian, gay, bisexual, transgender, queer, or questioning (LGBTQ) youth. a. Identify "safe spaces" (e.g., a counselor s office, designated classroom, student organization) where LGBTQ youth can receive support from administrators, teachers, or other school staff 86.0 85.6 96.9 86.8 100.0 b. Prohibit harassment based on a student s perceived or actual sexual orientation or gender identity 97.7 100.0 98.8 84.8 c. Encourage staff to attend professional development on safe and supportive school environments for all students, regardless of sexual orientation or gender identity 79.1 91.2 82.5 0 20 40 60 80 100 High Schools Middle Schools Junior/Senior High Schools All Schools Page 11 of 93
WISCONSIN 2024 School Health Profiles Report Weighted Principal Survey Results 8. Percentage of schools that engage in the following practices related to lesbian, gay, bisexual, transgender, queer, or questioning (LGBTQ) youth. 57.4 d. Facilitate access to providers not on school property who have experience in providing health services, including HIV/STI testing and counseling, to LGBTQ youth 58.2 60.3 58.1 71.5 e. Facilitate access to providers not on school property who have experience in providing social and psychological services to LGBTQ youth 72.2 71.5 71.8 0 20 40 60 80 100 High Schools Middle Schools Junior/Senior High Schools All Schools Page 12 of 93
WISCONSIN 2024 School Health Profiles Report Weighted Principal Survey Results 9. Percentage of schools that have a student-led club specifically focused on creating a safe, welcoming, and accepting school environment for racial and ethnic minority students. These clubs sometimes are called Anti-racism Alliances or racial/ethnic affinity groups. 46.7 36.5 31.0 40.1 0 20 40 60 80 100 High Schools Middle Schools Junior/Senior High Schools All Schools Page 13 of 93
WISCONSIN 2024 School Health Profiles Report Weighted Principal Survey Results 10. Percentage of schools that engaged in the following practices related to supporting racial/ethnic minority students. 64.2 a. Designated staff member(s) or office for leading and coordinating diversity, equity, and inclusion activities 56.9 72.4 61.3 67.3 68.6 b. Provided diversity, equity, and inclusion activities led and coordinated by school staff 77.9 68.9 79.7 81.9 c. Examined relevant data to identify racial/ethnic disparities in disciplinary practices 83.7 81.2 0 20 40 60 80 100 High Schools Middle Schools Junior/Senior High Schools All Schools Page 14 of 93
WISCONSIN 2024 School Health Profiles Report Weighted Principal Survey Results 10. Percentage of schools that engaged in the following practices related to supporting racial/ethnic minority students. 71.2 d. Encouraged staff to attend professional development on reducing racial/ethnic disparities (e.g., unconscious or implicit bias training, anti-discrimination training) 68.1 80.7 70.5 72.6 82.9 e. Implemented restorative disciplinary practices (e.g., restorative circles, peer mediation) 78.3 78.3 60.8 64.1 f. Facilitated access to providers who have experience in providing social and psychological services to racial/ethnic minority youth 62.8 62.6 0 20 40 60 80 100 High Schools Middle Schools Junior/Senior High Schools All Schools Page 15 of 93
WISCONSIN 2024 School Health Profiles Report Weighted Principal Survey Results 11. Percentage of schools in which all staff received professional development on preventing, identifying, and responding to student bullying and sexual harassment, including electronic aggression, during the past year. 83.5 78.9 71.0 80.0 0 20 40 60 80 100 High Schools Middle Schools Junior/Senior High Schools All Schools Page 16 of 93
WISCONSIN 2024 School Health Profiles Report Weighted Principal Survey Results 12. Percentage of schools that have a designated staff member to whom students can confidentially report student bullying and sexual harassment, including electronic aggression. 96.0 98.2 91.2 96.7 0 20 40 60 80 100 High Schools Middle Schools Junior/Senior High Schools All Schools Page 17 of 93
WISCONSIN 2024 School Health Profiles Report Weighted Principal Survey Results 13. Percentage of schools that have written protocols for the following suicide prevention practices. 94.0 a. Assessing student suicide risk 95.1 89.1 94.1 94.8 95.7 b. Notifying parents when a student is at risk for suicide 91.7 95.0 94.8 94.5 c. Referring students at risk for suicide to mental health services 94.3 94.6 0 20 40 60 80 100 High Schools Middle Schools Junior/Senior High Schools All Schools Page 18 of 93
WISCONSIN 2024 School Health Profiles Report Weighted Principal Survey Results 13. Percentage of schools that have written protocols for the following suicide prevention practices. 88.2 d. Responding to a suicide attempt at school 90.9 94.3 90.2 84.5 87.7 e. Supporting students returning to school after a suicide attempt 91.7 86.8 87.7 88.5 f. Responding to the death of a student or staff member from suicide 88.4 88.2 0 20 40 60 80 100 High Schools Middle Schools Junior/Senior High Schools All Schools Page 19 of 93
WISCONSIN 2024 School Health Profiles Report Weighted Principal Survey Results 14. Percentage of schools that taught a required physical education course in each of the following grades.* NA a. Grade 6 100.0 NA 100.0 NA 100.0 b. Grade 7 100.0 100.0 NA 100.0 c. Grade 8 94.2 99.1 0 20 40 60 80 100 High Schools Middle Schools Junior/Senior High Schools All Schools *Among schools with students in that grade. NA = Not available Page 20 of 93
WISCONSIN 2024 School Health Profiles Report Weighted Principal Survey Results 14. Percentage of schools that taught a required physical education course in each of the following grades.* d. Grade 9 94.9 NA 91.4 94.3 91.5 e. Grade 10 NA 94.0 92.0 79.5 f. Grade 11 NA 81.4 79.9 57.4 g. Grade 12 NA 71.9 60.4 0 20 40 60 80 100 High Schools Middle Schools Junior/Senior High Schools All Schools *Among schools with students in that grade. NA = Not available Page 21 of 93
WISCONSIN 2024 School Health Profiles Report Weighted Principal Survey Results 15. Percentage of schools in which the following types of staff attended professional development related to physical education or other strategies for integrating more physical activity into the school day during the past year. 82.7 a. Physical education teachers or specialists 85.0 58.8 81.6 29.5 19.3 b. Classroom teachers 34.0 24.7 28.0 29.0 c. Other school staff 34.0 29.1 0 20 40 60 80 100 High Schools Middle Schools Junior/Senior High Schools All Schools Page 22 of 93
WISCONSIN 2024 School Health Profiles Report Weighted Principal Survey Results 16. Percentage of schools that engage in the following physical education practices. a. Provide physical education teachers with a written physical education curriculum that aligns with national standards for physical education 78.2 79.5 70.6 78.1 b. Require physical education teachers to follow a written physical education curriculum 77.4 74.4 70.3 75.2 66.9 c. Allow the use of waivers, exemptions, or substitutions for physical education requirements for one grading period or longer 55.0 71.7 61.4 4.1 d. Allow teachers to exclude students from physical education to punish them for inappropriate behavior or failure to complete class work in another class 4.4 6.1 4.4 94.9 e. Require physical education teachers to be certified, licensed, or endorsed by the state in physical education 98.1 73.2 94.4 0 20 40 60 80 100 High Schools Middle Schools Junior/Senior High Schools All Schools Page 23 of 93
WISCONSIN 2024 School Health Profiles Report Weighted Principal Survey Results 16. Percentage of schools that engage in the following physical education practices. f. Limit physical education class sizes so that they are the same size as other subject areas 62.0 67.1 56.4 64.0 93.9 g. Have a dedicated budget for physical education materials and equipment 98.8 82.2 95.2 87.3 h. Provide adapted physical education (i.e., special courses separate from regular physical education courses) for students with disabilities as appropriate 87.8 86.0 87.4 98.5 i. Include students with disabilities in regular physical education courses as appropriate 100.0 100.0 99.4 0 20 40 60 80 100 High Schools Middle Schools Junior/Senior High Schools All Schools Page 24 of 93
WISCONSIN 2024 School Health Profiles Report Weighted Principal Survey Results 17. Percentage of schools in which students participate in physical activity in classrooms during the school day outside of physical education. 53.8 69.9 73.6 63.8 0 20 40 60 80 100 High Schools Middle Schools Junior/Senior High Schools All Schools Page 25 of 93
WISCONSIN 2024 School Health Profiles Report Weighted Principal Survey Results 18. Percentage of schools that offer opportunities for all students to be physically active during the school day, such as recess, lunchtime intramural activities, or physical activity clubs.* 75.8 96.8 77.0 86.5 0 20 40 60 80 100 High Schools Middle Schools Junior/Senior High Schools All Schools *Not including physical education and classroom physical activity. Page 26 of 93
WISCONSIN 2024 School Health Profiles Report Weighted Principal Survey Results 19. Percentage of schools that offer interscholastic sports to students. 90.3 93.0 85.8 91.2 0 20 40 60 80 100 High Schools Middle Schools Junior/Senior High Schools All Schools Page 27 of 93
WISCONSIN 2024 School Health Profiles Report Weighted Principal Survey Results 20. Percentage of schools that offer opportunities for students to participate in physical activity through organized physical activities or access to facilities or equipment for physical activity during the following times. 73.7 a. Before the school day 45.3 58.4 58.0 91.8 94.7 b. After the school day 82.4 92.4 0 20 40 60 80 100 High Schools Middle Schools Junior/Senior High Schools All Schools Page 28 of 93
WISCONSIN 2024 School Health Profiles Report Weighted Principal Survey Results 21. Percentage of schools that have a joint use agreement for shared use of the following school or community facilities. 72.1 a. Physical activity or sports facilities 68.3 41.5 67.3 37.0 41.2 b. Kitchen facilities and equipment 42.0 39.6 19.2 23.7 c. Gardens (e.g., herb or vegetable plots) 19.6 21.5 0 20 40 60 80 100 High Schools Middle Schools Junior/Senior High Schools All Schools Page 29 of 93
WISCONSIN 2024 School Health Profiles Report Weighted Principal Survey Results 22. Percentage of schools that have a written plan for providing opportunities for students to be physically active before, during, and after school. 16.3 30.0 26.2 24.2 0 20 40 60 80 100 High Schools Middle Schools Junior/Senior High Schools All Schools Page 30 of 93
WISCONSIN 2024 School Health Profiles Report Weighted Principal Survey Results 23. Percentage of schools that have assessed opportunities available to students to be physically active before, during, or after school. 45.4 60.8 54.8 54.1 0 20 40 60 80 100 High Schools Middle Schools Junior/Senior High Schools All Schools Page 31 of 93
WISCONSIN 2024 School Health Profiles Report Weighted Principal Survey Results 24. Percentage of schools that have adopted a policy prohibiting tobacco use. 97.1 98.7 100.0 98.2 0 20 40 60 80 100 High Schools Middle Schools Junior/Senior High Schools All Schools Page 32 of 93
WISCONSIN 2024 School Health Profiles Report Weighted Principal Survey Results 25A. (Students) Percentage of schools that have a tobacco-use prevention policy that specifically prohibits the use of each type of tobacco for students during any school-related activity. a. Cigarettes 97.1 98.1 100.0 97.9 b. Smokeless tobacco (e.g., chewing tobacco, snuff, dip, snus, dissolvable tobacco) 96.2 97.5 100.0 97.3 93.0 c. Cigars 96.9 97.4 95.4 92.0 d. Pipes 96.3 94.8 94.5 97.1 e. Electronic vapor products (e.g., e- cigarettes, vapes, vape pens, e-hookahs, mods, or brands such as JUUL or Vuse) 98.1 100.0 97.9 0 20 40 60 80 100 High Schools Middle Schools Junior/Senior High Schools All Schools Page 33 of 93
WISCONSIN 2024 School Health Profiles Report Weighted Principal Survey Results 25B. (Faculty/Staff) Percentage of schools that have a tobacco-use prevention policy that specifically prohibits the use of each type of tobacco for faculty/staff during any school-related activity. a. Cigarettes 97.1 97.5 100.0 97.6 b. Smokeless tobacco (e.g., chewing tobacco, snuff, dip, snus, dissolvable tobacco) 96.2 96.9 97.3 96.7 93.0 c. Cigars 96.3 97.3 95.1 91.2 d. Pipes 96.3 97.3 94.4 97.1 e. Electronic vapor products (e.g., e- cigarettes, vapes, vape pens, e-hookahs, mods, or brands such as JUUL or Vuse) 98.1 100.0 97.9 0 20 40 60 80 100 High Schools Middle Schools Junior/Senior High Schools All Schools Page 34 of 93
WISCONSIN 2024 School Health Profiles Report Weighted Principal Survey Results 25C. (Visitors) Percentage of schools that have a tobacco-use prevention policy that specifically prohibits the use of each type of tobacco for visitors during any school-related activity. a. Cigarettes 96.3 97.5 100.0 97.3 b. Smokeless tobacco (e.g., chewing tobacco, snuff, dip, snus, dissolvable tobacco) 94.6 96.9 97.3 96.0 92.2 c. Cigars 96.9 97.3 95.1 91.2 d. Pipes 96.3 97.3 94.4 96.3 e. Electronic vapor products (e.g., e- cigarettes, vapes, vape pens, e-hookahs, mods, or brands such as JUUL or Vuse) 98.1 100.0 97.6 0 20 40 60 80 100 High Schools Middle Schools Junior/Senior High Schools All Schools Page 35 of 93
WISCONSIN 2024 School Health Profiles Report Weighted Principal Survey Results 26A. (Students) Percentage of schools that have a tobacco-use prevention policy that specifically prohibits tobacco use during each of the following times for students. 96.3 a. During school hours 98.7 94.8 97.4 92.3 93.9 b. During non-school hours 73.4 91.4 0 20 40 60 80 100 High Schools Middle Schools Junior/Senior High Schools All Schools Page 36 of 93
WISCONSIN 2024 School Health Profiles Report Weighted Principal Survey Results 26B. (Faculty/Staff) Percentage of schools that have a tobacco-use prevention policy that specifically prohibits tobacco use during each of the following times for faculty/staff. 95.5 a. During school hours 98.1 94.8 96.8 87.4 90.6 b. During non-school hours 57.0 86.1 0 20 40 60 80 100 High Schools Middle Schools Junior/Senior High Schools All Schools Page 37 of 93
WISCONSIN 2024 School Health Profiles Report Weighted Principal Survey Results 26C. (Visitors) Percentage of schools that have a tobacco-use prevention policy that specifically prohibits tobacco use during each of the following times for visitors. 95.5 a. During school hours 98.1 92.3 96.5 87.4 90.0 b. During non-school hours 59.6 86.1 0 20 40 60 80 100 High Schools Middle Schools Junior/Senior High Schools All Schools Page 38 of 93
WISCONSIN 2024 School Health Profiles Report Weighted Principal Survey Results 27A. (Students) Percentage of schools that have a tobacco-use prevention policy that specifically prohibits tobacco use in each of the following locations for students. a. In school buildings 97.1 98.7 100.0 98.2 97.1 b. Outside on school grounds, including parking lots and playing fields 98.7 100.0 98.2 95.6 c. On school buses or other vehicles used to transport students 98.7 97.3 97.3 96.3 d. At off-campus, school-sponsored events 98.7 94.7 97.4 0 20 40 60 80 100 High Schools Middle Schools Junior/Senior High Schools All Schools Page 39 of 93
WISCONSIN 2024 School Health Profiles Report Weighted Principal Survey Results 27B. (Faculty/Staff) Percentage of schools that have a tobacco-use prevention policy that specifically prohibits tobacco use in each of the following locations for faculty/staff. a. In school buildings 97.1 98.7 100.0 98.2 94.7 b. Outside on school grounds, including parking lots and playing fields 97.5 100.0 96.6 94.8 c. On school buses or other vehicles used to transport students 98.7 100.0 97.3 92.1 d. At off-campus, school-sponsored events 95.7 94.5 94.1 0 20 40 60 80 100 High Schools Middle Schools Junior/Senior High Schools All Schools Page 40 of 93
WISCONSIN 2024 School Health Profiles Report Weighted Principal Survey Results 27C. (Visitors) Percentage of schools that have a tobacco-use prevention policy that specifically prohibits tobacco use in each of the following locations for visitors. a. In school buildings 96.3 98.7 100.0 97.9 95.5 b. Outside on school grounds, including parking lots and playing fields 97.5 96.7 96.7 92.3 c. On school buses or other vehicles used to transport students 98.1 100.0 96.0 77.6 d. At off-campus, school-sponsored events 89.5 72.5 83.2 0 20 40 60 80 100 High Schools Middle Schools Junior/Senior High Schools All Schools Page 41 of 93
WISCONSIN 2024 School Health Profiles Report Weighted Principal Survey Results 27N. Percentage of schools that follow a policy that mandates a tobacco-free environment. A tobacco-free environment is one that prohibits tobacco use by students, staff, and visitors in school buildings, at school functions, in school vehicles, on school grounds, and at off-site school events, applicable 24 hours a day and seven days a week. 66.9 76.8 44.7 69.7 0 20 40 60 80 100 High Schools Middle Schools Junior/Senior High Schools All Schools Page 42 of 93
WISCONSIN 2024 School Health Profiles Report Weighted Principal Survey Results TOBVAPE. Percentage of schools that follow a policy that mandates a tobacco-free environment including prohibiting electronic vapor products. A tobacco-free environment is one that prohibits tobacco and EVP use by students, staff, and visitors in school buildings, at school functions, in school vehicles, on school grounds, and at off-site school events, applicable 24 hours a day and seven days a week. 66.9 76.8 44.7 69.7 0 20 40 60 80 100 High Schools Middle Schools Junior/Senior High Schools All Schools Page 43 of 93
WISCONSIN 2024 School Health Profiles Report Weighted Principal Survey Results 28_1. (Never) Percentage of schools that never take the following actions when students are caught using electronic vapor products. a. Issue a warning to the student 26.5 26.6 29.4 26.8 0.7 b. Confiscate product 0.6 0.0 0.6 0.7 c. Notify parents or guardians 0.6 0.0 0.6 5.7 d. Develop a behavior contract with the student 3.6 8.0 4.8 0 20 40 60 80 100 High Schools Middle Schools Junior/Senior High Schools All Schools Page 44 of 93
WISCONSIN 2024 School Health Profiles Report Weighted Principal Survey Results 28_1. (Never) Percentage of schools that never take the following actions when students are caught using electronic vapor products. e. Refer to a school counselor 5.6 1.2 10.7 3.8 0.7 f. Refer to a school administrator 0.6 0.0 0.6 10.9 g. Refer to an assistance, education, or cessation program 9.7 18.2 11.0 9.5 h. Refer to legal authorities (e.g., school resource officer) 7.3 6.1 8.1 0 20 40 60 80 100 High Schools Middle Schools Junior/Senior High Schools All Schools Page 45 of 93
WISCONSIN 2024 School Health Profiles Report Weighted Principal Survey Results 28_1. (Never) Percentage of schools that never take the following actions when students are caught using electronic vapor products. i. Issue an in-school suspension (half day or full day) 11.8 8.9 17.3 10.9 59.7 j. Issue an after-school or weekend detention 60.7 65.8 60.8 7.2 k. Issue an out-of-school suspension 4.3 2.7 5.3 45.6 l. Expel from school 50.6 35.7 47.2 0 20 40 60 80 100 High Schools Middle Schools Junior/Senior High Schools All Schools Page 46 of 93
WISCONSIN 2024 School Health Profiles Report Weighted Principal Survey Results 28_2. (Rarely) Percentage of schools that rarely take the following actions when students are caught using electronic vapor products. a. Issue a warning to the student 8.0 8.9 6.6 8.4 0.0 b. Confiscate product 0.0 0.0 0.0 0.8 c. Notify parents or guardians 0.0 0.0 0.3 10.9 d. Develop a behavior contract with the student 9.9 5.3 9.9 0 20 40 60 80 100 High Schools Middle Schools Junior/Senior High Schools All Schools Page 47 of 93
WISCONSIN 2024 School Health Profiles Report Weighted Principal Survey Results 28_2. (Rarely) Percentage of schools that rarely take the following actions when students are caught using electronic vapor products. e. Refer to a school counselor 6.7 6.0 11.8 6.8 0.0 f. Refer to a school administrator 0.0 0.0 0.0 13.7 g. Refer to an assistance, education, or cessation program 12.7 5.3 12.4 3.1 h. Refer to legal authorities (e.g., school resource officer) 7.4 3.2 5.3 0 20 40 60 80 100 High Schools Middle Schools Junior/Senior High Schools All Schools Page 48 of 93
WISCONSIN 2024 School Health Profiles Report Weighted Principal Survey Results 28_2. (Rarely) Percentage of schools that rarely take the following actions when students are caught using electronic vapor products. i. Issue an in-school suspension (half day or full day) 12.3 10.4 14.4 11.5 18.1 j. Issue an after-school or weekend detention 13.4 12.4 15.2 15.5 k. Issue an out-of-school suspension 19.3 12.1 17.1 33.0 l. Expel from school 27.3 40.1 30.8 0 20 40 60 80 100 High Schools Middle Schools Junior/Senior High Schools All Schools Page 49 of 93
WISCONSIN 2024 School Health Profiles Report Weighted Principal Survey Results 28_3. (Sometimes) Percentage of schools that sometimes take the following actions when students are caught using electronic vapor products. a. Issue a warning to the student 14.4 7.1 18.9 11.0 0.0 b. Confiscate product 0.7 3.2 0.6 2.3 c. Notify parents or guardians 0.6 2.7 1.5 59.6 d. Develop a behavior contract with the student 55.2 63.4 57.7 0 20 40 60 80 100 High Schools Middle Schools Junior/Senior High Schools All Schools Page 50 of 93