Workforce Performance Report July 2018 - Highlights and Analysis
The Workforce Performance Report for July 2018, led by Executive Tim Boylin, reveals significant increases in temporary staffing spend, particularly in agency and bank spending. The report details changes in staffing patterns, areas contributing to spend growth, initiatives to reduce agency use, and the impact on patient care. Key highlights include a rise in total temporary staffing spend to 3.72m and a shift towards utilizing more bank hours.
Download Presentation

Please find below an Image/Link to download the presentation.
The content on the website is provided AS IS for your information and personal use only. It may not be sold, licensed, or shared on other websites without obtaining consent from the author. If you encounter any issues during the download, it is possible that the publisher has removed the file from their server.
You are allowed to download the files provided on this website for personal or commercial use, subject to the condition that they are used lawfully. All files are the property of their respective owners.
The content on the website is provided AS IS for your information and personal use only. It may not be sold, licensed, or shared on other websites without obtaining consent from the author.
E N D
Presentation Transcript
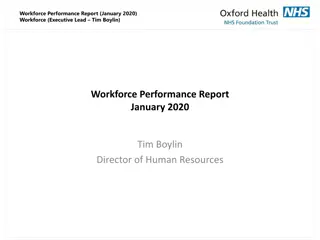
Workforce Performance Report (July 2018) Workforce (Executive Lead Tim Boylin) Workforce Performance Report July 2018 Tim Boylin Director of Human Resources
Workforce Performance Report (July 2018) Workforce (Executive Lead Tim Boylin) Total temporary staffing spend increased by 784K to 3.72m, 18.69% of payroll, the second highest level in 2 years. This increase was seen across all directorates, Bank spend reached its highest ever level of 1.15m, 7.41% of payroll nearly double that of the same time last year excluding GPs. Agency Spend increased to 2.25m, its second highest level in 2 years 10.91% of payroll. The number of bank hours filled through the WFMS exceeded the number of agency hours for the first time since all agency has been included on the WFMS. Temporary Staffing Spend The following areas contributed to the increase in temporary staffing spend, 300k, Inpatient units, 178k, Admin and Clerical, 170k registered nursing in community services, 128K medical and dental staffing. This Month: 18.69% 3.72m Last Month: 15.03% 2.94m Last Year: 12.87% 2.39m
Workforce Performance Report (July 2018) Workforce (Executive Lead Tim Boylin) Agency spend increased by 506K in June compared to May. 178k of this was in the Admin and Clerical Staffing group of which 100k was in corporate services, Medical and Dental Agency spend increased by 124k in the Adults directorate and Nursing spend increased by 400k of which 170k was across community teams of which 118k was in older peoples (83K in Continuing Healthcare Bucks for a short term funded project) and 57k in AMHTs . An Exec level review of all admin and clerical agency use is to take place with a plan to be put into place to reduce this significantly. NHSI Agency rule overrides have increased significantly, whilst some of this increase can be attributed to the HCA agency reduction plan, a significant proportion of this cannot be. 56% of temporary staffing shifts booked through the WFMS were to cover vacancies. Temporary Staffing Spend
Workforce Performance Report (July 2018) Workforce (Executive Lead Tim Boylin) Since November 2018 the Trust has been working towards removing all HCA agency use across inpatient units from 14 May 2018. The Trust has decided to engage registered Flexible Workers or agency workers where an HCA Flexible Worker could not be sourced. The number of agency hours worked has decreased by 10k from 29k in April to 19k June, however the agency spend has only decreased slightly by 33k from 783kin April to 749k in June due to the grade swop policy. Units have reported benefits from the increased skill mix and no detrimental effect to patient care has been seen as a result of stopping HCA agency use. The graphs below show the change in agency hours used and cost. HCA Agency Spend Reduction Agency spend in the Additional Clinical Services staffing group has fallen by 366k from 382k in April to 16k in June, however Registered Nursing agency spend has increased by 290k from 444K to 733K. Bank spend has increased by 198k from 518k in April to 716k in June. The majority of this increase is in non registered staffing use. Overall temporary staffing spend has increased across inpatient areas increased by 164K from 1,301K to 1,465K. The number of hours worked decreased from April to June by 4,350 from 58,422 to 54,071. Recruitment of HCA Flexible Workers is continuing to reduce the number of grade swops and agency overrides. Floating bank workers are also being introduced for each site to support last minute requirements and prevent agency usage. A review is to take place as to the financial viability of continuing with the grade swop policy whilst further bank recruitment of HCA workers occurs.
Workforce Performance Report (July 2018) Workforce (Executive Lead Tim Boylin) Total Payroll Spend The Trust overspent the payroll budget by 60k in May and is 104K overspend YTD June Older Peoples: - 190k Adults: + 102k C&YP: + 188k Corporate: - 41.3k YTD - 286k + 85K + 353K - 49.5K
Workforce Performance Report (July 2018) Workforce (Executive Lead Tim Boylin) The Vacancy rate has increased to 13.9% in June from 12.0% in May. The increase was driven by an addition to budgeted FTE in all Directorates, most notably in the Adult Directorate and Research and Development service in Corporate Directorate. Vacancy Target: 9.0% This Month: 13.9% Last Month: 12.0% Last Year: 11.9% Current Recruitment Activity - Vacancy Progress (by number of posts) Sum of CandidateCount Origin Live Vacancy Adverts VacancyStage 0 - Awaiting Sign Off VacancyDirectorate Buckinghamshire Mental Health Community Health Corporate Oxfordshire Mental Health Specialised Services 1 - With Recruitment - Not Live 2 - At Advert 3 - At Shortlist 4 - At Interview 5 - At Offer 6 - Offer Accepted Grand Total 4 4 26 59 36 67 15 16 14 25 54 28 12 76 18 13 8 6 116 128 142 35 497 68 195 56 144 49 512 1009 1 13 15 11 16 12 57 16 2 2 3 1 Live Vacancy Adverts Total Live Candidate Adverts 37 23 203 55 122 Buckinghamshire Mental Health Community Health Corporate Oxfordshire Mental Health Specialised Services 68 195 56 144 49 512 512 Live Candidate Adverts Total Grand Total 37 23 203 55 122 57
Workforce Performance Report (July 2018) Workforce (Executive Lead Tim Boylin) Sickness has decreased over the last five months to stand at 3.79%. The general decrease has been experienced across all directorates. However, June has seen an increase in the Older Peoples Directorate in the Mental Health Inpatient and Urgent Care Services. Sickness Target: 3.50% This Month: 3.79% Last Month: 3.86% Last Year: 3.69%
Workforce Performance Report (July 2018) Workforce (Executive Lead Tim Boylin) The Turnover figure has decreased to stand at 14.3%. The decrease has been driven by a long term decline over the last six months in the Older Peoples and Children and Young Peoples directorates. Turnover Target: 12.0% This Month: 14.3% Last Month: 14.4% Last Year: 14.8%
Workforce Performance Report (July 2018) Workforce (Executive Lead Tim Boylin) WRES Indicators 1& 2 - Chart showing NHS Jobs applicants ethnic origin Indicator 2: Likelihood of being appointed 80.00% 80.00% 60.00% 60.00% White Applicants White Applicants 40.00% 40.00% BME applicants BME applicants 20.00% 20.00% Not disclosed Not disclosed 0.00% 0.00% Sept July Feb Dec Nov April Aug Jan-18 Oct May June June March Sept July Dec Nov April Aug Jan-18 Oct May June June March Feb Indicator 3: Likelihood of BME staff entering disciplinary process Note: 83% of staff are white, 17% from other groups 90.00% 80.00% 70.00% 60.00% 50.00% White 40.00% BME 30.00% Not disclosed 20.00% 10.00% 0.00% Sept July Nov Dec Feb Aug May Jan-18 April June Oct June March
Workforce Performance Report (July 2018) Workforce (Executive Lead Tim Boylin) WRES Indicator 6: Bullying by staff Percentage experiencing bullying from patients 35.00% 45.00% 40.00% 30.00% 35.00% 25.00% 30.00% 20.00% 25.00% White 20.00% BME 15.00% 15.00% 10.00% 10.00% 5.00% 5.00% 0.00% 2014 2015 2016 2017 0.00% 2014 2015 2016 2017 White BME Indicator 7: %age believing Trust provides equal opportunities 100.00% 80.00% 60.00% White BME 40.00% 20.00% 0.00% 2014 2015 2016 2017


