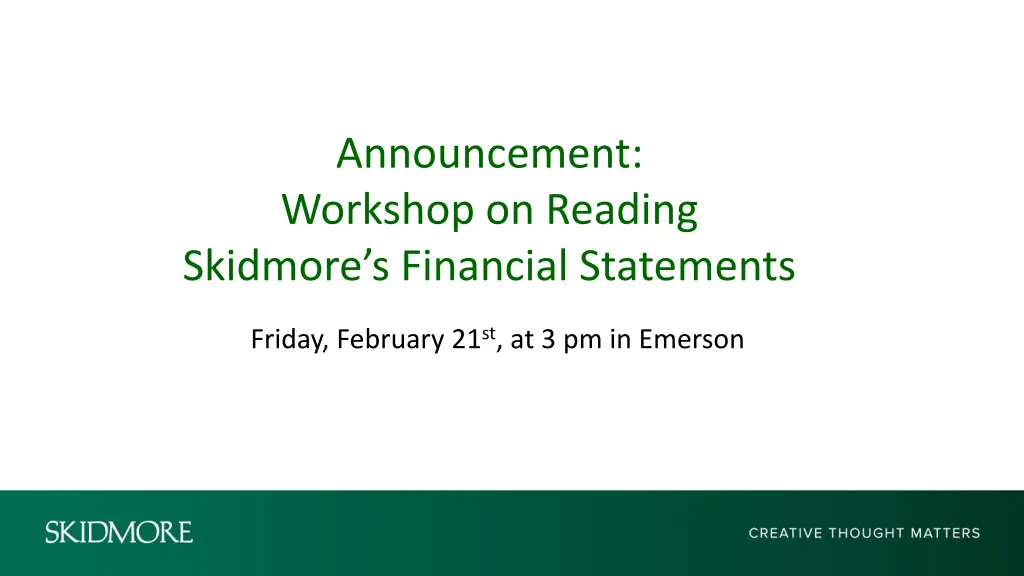
Workshop on Understanding Skidmore's Financial Statements
Join us on Friday, February 21st at 3 pm in Emerson for a workshop on reading Skidmore's financial statements. Learn why economic sustainability is crucial, what to expect, and explore the FY 2020-2024 statement of activities. Discover key insights into operating revenue, expenses, and surplus for a comprehensive understanding of Skidmore's financial health.

Download Presentation

Please find below an Image/Link to download the presentation.
The content on the website is provided AS IS for your information and personal use only. It may not be sold, licensed, or shared on other websites without obtaining consent from the author. If you encounter any issues during the download, it is possible that the publisher has removed the file from their server.
You are allowed to download the files provided on this website for personal or commercial use, subject to the condition that they are used lawfully. All files are the property of their respective owners.
The content on the website is provided AS IS for your information and personal use only. It may not be sold, licensed, or shared on other websites without obtaining consent from the author.
E N D
Presentation Transcript
Announcement: Workshop on Reading Skidmore s Financial Statements Friday, February 21st, at 3 pm in Emerson
Why? And What to Expect o Skidmore must be economically sustainable to succeed. o Our financial statements accurately report our financial condition. o Our finances are fundamentally sound. o We can see trends in our financial statements that we need to be paying attention to now. o Here s a quick preview.
Skidmore Statement of Activities FY 2020 FY 2021 FY 2022 FY 2023 FY 2024 Operating Revenue Tuition and fees, net institutional aid Sales and services of auxilary enterprises Private gifts and grants Government grants and appropriations Dividends and interest Realized gains used to support operations Other Total Operating Revenue 95,390,041 33,996,217 9,551,530 4,420,947 1,491,962 19,100,277 2,296,031 166,247,005 150,998,178 176,480,942 186,851,896 195,472,282 88,063,402 26,098,142 9,867,893 6,084,983 1,013,265 19,351,787 518,706 93,756,268 35,890,727 12,105,747 6,752,886 1,301,580 22,407,084 4,266,650 99,496,652 104,478,973 41,124,981 11,725,833 3,239,068 4,033,138 21,877,869 5,354,355 42,894,246 11,405,638 3,786,457 7,020,233 19,407,964 6,478,771 Operating Expenses Instruction Research Academic support Student services Institutional support Auxilary enterprises Total Operating Expenses 59,049,407 2,762,959 17,961,989 19,151,190 33,248,167 26,799,084 158,972,796 149,552,780 164,655,037 176,766,284 189,375,031 52,592,989 1,969,980 16,463,011 18,382,375 35,922,133 24,222,292 62,291,829 2,106,723 17,400,693 20,556,018 35,042,170 27,257,604 68,708,286 2,764,472 18,111,740 22,049,826 34,805,255 30,326,705 72,705,455 3,097,386 20,618,053 23,638,440 37,017,492 32,298,205 Operating Surplus 7,274,209 1,445,398 11,825,905 10,085,612 6,097,251 Source: Audited Financial Statements
Skidmore Statement of Activities FY 2020 FY 2021 FY 2022 FY 2023 FY 2024 Operating Revenue Tuition and fees, net institutional aid Sales and services of auxilary enterprises Private gifts and grants Government grants and appropriations Dividends and interest Realized gains used to support operations Other Total Operating Revenue 57.4% 20.4% 5.7% 2.7% 0.9% 11.5% 1.4% 100.0% 58.3% 17.3% 6.5% 4.0% 0.7% 12.8% 0.3% 100.0% 53.1% 20.3% 6.9% 3.8% 0.7% 12.7% 2.4% 100.0% 53.2% 22.0% 6.3% 1.7% 2.2% 11.7% 2.9% 100.0% 53.4% 21.9% 5.8% 1.9% 3.6% 9.9% 3.3% 100.0% Operating Expenses Instruction Research Academic support Student services Institutional support Auxilary enterprises Total Operating Expenses 35.5% 1.7% 10.8% 11.5% 20.0% 16.1% 95.6% 34.8% 1.3% 10.9% 12.2% 23.8% 16.0% 99.0% 35.3% 1.2% 9.9% 11.6% 19.9% 15.4% 93.3% 36.8% 1.5% 9.7% 11.8% 18.6% 16.2% 94.6% 37.2% 1.6% 10.5% 12.1% 18.9% 16.5% 96.9% Operating Surplus 4.4% 1.0% 6.7% 5.4% 3.1% Source: Audited Financial Statements
5-Year Trends in Our Discount Rate and Net Tuition Per Student FY 2020 55,646,000 36.8% FY 2021 57,449,000 39.5% FY 2022 64,624,000 40.8% FY 2023 69,786,000 41.2% FY 2024 73,338,000 41.2% Institutional financial aid Discount rate Net tuition (price) per student Increase Consumer Price Index (CPI) $33,627 $34,010 1.1% 1.2% $33,872 -0.4% 4.7% $35,192 3.9% 8.0% $36,632 4.1% 4.1% Sources: Audited Financial Statements; Operating Budget; U.S. Bureau of Labor Statistics
Industry and Peer Institution Context Matter Peer Analysis Based on: o Quality & Prestige o Wealth o Enrollment Size o Revenues & Expenditures o Alternative Enrollments o Admissions Yield Euclidean distance is the square root of the sum of the squared differences between values for each of the 6 factors. Simply put, the greater the number, the more distant the institution is from Skidmore in likeness. Source: A Data-Driven Model for Examining the Validity of Skidmore s Peer Institution Set -- Skidmore Office of Institutional Research
Industry and Peer Institution Context Enrollment Enrollment Skidmore % Change AY19- 20 2,663 AY20-21 2,582 -3.0% AY21-22 2,686 4.0% AY22-23 2,758 2.7% AY23-24 Oveall 2,776 Change 0.7% 4.2% St. Lawrence % Change 2,434 2,319 -4.7% 2,279 -1.7% 2,175 -4.6% 2,068 -4.9% -15.0% Union % Change 2,189 2,047 -6.5% 2,096 2.4% 2,107 0.5% 2,082 -1.2% -4.9% Vassar % Change 2,441 2,435 -0.2% 2,516 3.3% 2,459 -2.3% 2,456 -0.1% 0.6% Source: Common Data Sets
Industry and Peer Institution Context Endowment Endowment Skidmore Endowment/Student AY19- 20 357,075,275 134,088 AY20-21 494,836,770 191,649 AY21-22 454,900,049 169,360 AY22-23 428,878,236 155,503 AY23-24 488,200,830 175,865 St. Lawrence Endowment/Student 322,771,681 132,610 405,077,133 174,678 352,923,378 154,859 378,997,553 174,252 416,833,841 201,564 Union Endowment/Student 478,019,726 218,374 598,746,292 292,499 501,796,213 239,407 522,125,163 247,805 NA Vassar Endowment/Student 1,097,975,650 1,378,988,147 1,196,336,464 1,224,163,708 1,300,989,120 449,806 566,320 475,491 497,830 529,719 Sources: Common Data Sets and Audited Financial Statements
Context: Net Tuition, Aid, and Discount Rate Tuition and Fees, net Skidmore Per Student Institutional Aid Discount Rate St. Lawrence Per Student Institutional Aid Discount Rate Union Per Student Institutional Aid Discount Rate Vassar Per Student Institutional Aid Discount Rate AY19- 20 95,390,041 $35,821 55,646,000 36.8% 55,495,363 $22,800 79,349,771 58.8% 72,298,098 $33,028 51,594,012 41.6% 79,841,777 $32,709 69,038,494 46.4% AY20-21 88,063,402 $34,107 57,449,000 39.5% 51,668,918 $22,281 77,095,652 59.9% 64,992,330 $31,750 53,553,085 45.2% 81,822,414 $33,603 64,025,821 43.9% AY21-22 93,756,268 $34,906 64,624,000 40.8% 48,879,860 $21,448 83,530,311 63.1% 62,884,942 $30,002 61,243,818 49.3% 91,783,312 $36,480 67,607,577 42.4% AY22-23 99,496,652 $36,076 69,786,000 41.2% 47,761,164 $21,959 83,831,510 63.7% 62,332,161 $29,583 66,971,352 51.8% 94,869,853 $38,581 69,114,338 42.1% AY23-24 104,478,973 $37,637 5-Year 73,338,000 Change 41.2% 4.4% 44,211,343 $21,379 86,012,936 66.0% 7.2% NA Note: In some reporting Vassar and Union brake out their institutional aid separately by Tuition and Room & Board. This discount rate analysis assumes all institutional aid is deducted from Tuition and Fees so we can compare them to Skidmore and St. Lawrence based on our reporting conventions. 10.1% 99,509,396 $40,517 72,539,824 42.2% -4.2% Sources: Common Data Sets and Audited Financial Statements
SLU Union* Vassar Skidmore Operating Revenue Tuition and fees, net Auxilary services Tuition, fees, and auxilary services Private gifts and grants Government grants and appropriations Dividends and interest Realized gains used to support operations Other Total Operating Revenue Context: FY2024 Common-Sized Operating Revenues and Expenses 60.9% 7.1% 68.0% 10.9% 2.4% 0.0% 16.2% 2.4% 100.0% 65.2% 1.9% 67.1% 5.1% 4.3% 1.4% 19.4% 2.6% 100.0% 60.3% 1.7% 62.0% 7.3% 1.3% 0.0% 27.9% 1.5% 100.0% 53.4% 21.9% 75.3% 5.8% 1.9% 3.6% 9.9% 3.3% 100.0% ** Operating Expenses Instruction Research Academic support Student services Institutional support Auxilary enterprises Total Operating Expenses 35.9% 2.2% 12.7% 21.1% 18.4% 25.2% 115.6% 40.9% 0.6% 10.4% 15.7% 20.6% 19.3% 107.6% 36.7% 1.5% 16.5% 14.2% 18.8% 13.8% 101.6% 37.2% 1.6% 10.5% 12.1% 18.9% 16.5% 96.9% *Union s data is for FY2023 **This line includes Room and Board for SLU, Union and Vassar Operating Margin -15.6% -7.6% -1.6% 3.1% Source: Audited Financial Statements
Announcement: Workshop on Reading Skidmore s Financial Statements Friday, February 21st, at 3 pm in Emerson