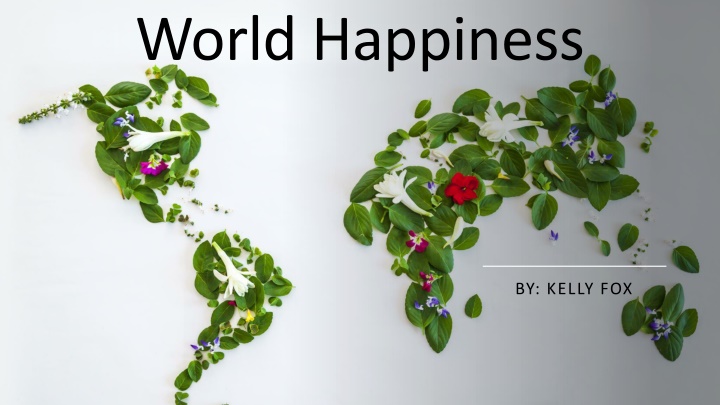
Explore the analysis of World Happiness Reports from 2015 to 2019, sourced from Gallup World Poll data. This dataset delves into how happiness is measured, including factors such as Cantril Ladder scores, social support, life expectancy, freedom of choice, generosity, and perceptions of corruption.
Please find below an Image/Link to download the presentation.
The content on the website is provided AS IS for your information and personal use only. It may not be sold, licensed, or shared on other websites without obtaining consent from the author. If you encounter any issues during the download, it is possible that the publisher has removed the file from their server.
You are allowed to download the files provided on this website for personal or commercial use, subject to the condition that they are used lawfully. All files are the property of their respective owners.
The content on the website is provided AS IS for your information and personal use only. It may not be sold, licensed, or shared on other websites without obtaining consent from the author.
Kaggle.com Where is This Data From? Gallup World Poll (GWP) According to Gallup World Poll, the sample size is 1,000 people per country
Intrigued me How exactly does one measure happiness? Why I Chose this Dataset Happiness is important for well being health, decisions, relationships, work and goals Relatable thinking about your own happiness
Cantril Ladder: Please imagine a ladder, with steps numbered from 0 at the bottom to 10 at the top. The top of the ladder represents the best possible life for you and the bottom of the ladder represents the worst possible life for you. On which step of the ladder would you say you personally feel you stand at this time? How is Happiness Scored?
1. Rank 2. Country/Region 3. Economy Attributes After Cleaning 4. Social Support 5. Healthy Life Expectancy 6. Freedom to Make Life Choices 7. Generosity 8. Perceptions of Corruption 9. Happiness Score
1. Rank highest happiness score by country to lowest. 2. Country/Region Name 3. Economy/GDP Gross Domestic Product (GDP)-per-capita time series from the year using country- specific forecasts of real GDP growth How Are They Scored? 4. Social Support binary responses (either 0 or 1) to the GWP question If you were in trouble, do you have relatives or friends you can count on to help you whenever you need them, or not?
5. Healthy Life Expectancy data extracted from the World Health Organization s (WHO) Global Health Observatory data repository. How Are They Scored? (cont.) 6. Freedom to Make Life Choices question: Are you satisfied or dissatisfied with your freedom to choose what you do with your life? 7. Generosity question: Have you donated money to a charity in the past month?
8. Perceptions of Corruption average of the survey responses to two questions: Is corruption widespread throughout the government or not and Is corruption widespread within businesses or not? The overall perception is just the average of the two responses. How Are They Scored? (cont.) 9. Happiness Score This is the average response to the question of life evaluations which are above.
1. Change a .csv to .arff 2. Clean the data got rid of and renamed some attributes 3. Made the happiness score the target attribute First Steps 4. Removed the attributes country/region and rank
LinearRegression for each year: 2015: Correlation coefficient 0.8668 2016: Correlation coefficient 0.8781 Linear Regression 2017: Correlation coefficient 0.886 2018: Correlation coefficient 0.8693 2019: Correlation coefficient 0.8713
Results of LinearRegression ran on each attribute with the target attribute happiness score, the following is their correlation coefficients results: 2015 2016 2017 2018 2019 Economy 0.77 0.78 0.81 0.80 0.79 Social Support 0.72 0.73 0.75 0.74 0.77 Life Expectancy 0.72 0.76 0.77 0.77 0.77 Freedom 0.55 0.55 0.55 0.53 0.55 Generosity 0.08 -0.076 -0.02 -0.07 -0.34 Perceptions of Corruption 0.35 0.37 0.39 0.35 0.35
Other Attribute: CorrelationAttributeEval 2015 Economy (GDP per Capita) 2016 Economy (GDP per Capita) 2017 Economy (GDP Per Capita) 2018 Economy (GDP Per Capita) 2019 Economy (GDP Per Capita) Ranked 1st 0.781 0.79 0.812 0.802 0.7939 Ranked 2nd Social Support Social Support Social Support Social Support Social Support 0.741 0.739 0.753 0.746 0.7771 Ranked 3rd Life Expectancy Life Expectancy Life Expectancy Life Expectancy Life Expectancy 0.724 0.765 0.782 0.776 0.7799 Ranked 4th Freedom Freedom Freedom Freedom Freedom 0.568 Generosity 0.567 Generosity 0.57 Generosity 0.544 Generosity 0.5667 Generosity Ranked 5th 0.18 Perceptions of Corruption 0.157 Perceptions of Corruption 0.155 Perceptions of Corruption 0.136 Perceptions of Corruption 0.0758 Perceptions of Corruption Ranked 6th 0.395 0.402 0.429 0.392 0.3856
Who Can Use This? Country/Regions Governments Future Uses COVID-19
1. Finland Best 2. Denmark Countries - 2019 3. Norway 19. United States