Zero Greenhouse Gas Simulation in Regional Agriculture
This study presents a method for simulating zero greenhouse gas emissions in the agricultural sector of Hindmarsh, Yarriambiack, and Horsham rural economies. It explores the impacts of reducing GHGs on regional economies and primary production, utilizing input-output tables and data analysis to examine the relationship between sector balance and emissions. The findings suggest a positive correlation between GHG reduction and sector balance, with implications for policy and further research.

Download Presentation

Please find below an Image/Link to download the presentation.
The content on the website is provided AS IS for your information and personal use only. It may not be sold, licensed, or shared on other websites without obtaining consent from the author.If you encounter any issues during the download, it is possible that the publisher has removed the file from their server.
You are allowed to download the files provided on this website for personal or commercial use, subject to the condition that they are used lawfully. All files are the property of their respective owners.
The content on the website is provided AS IS for your information and personal use only. It may not be sold, licensed, or shared on other websites without obtaining consent from the author.
E N D
Presentation Transcript
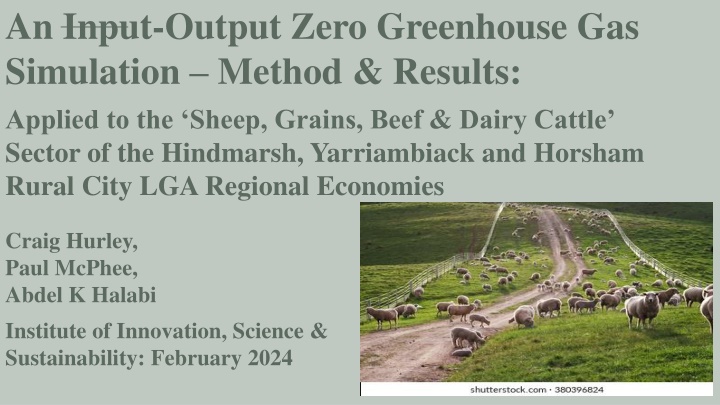
An Input-Output Zero Greenhouse Gas Simulation Method & Results: Applied to the Sheep, Grains, Beef & Dairy Cattle Sector of the Hindmarsh, Yarriambiack and Horsham Rural City LGA Regional Economies Craig Hurley, Paul McPhee, Abdel K Halabi Institute of Innovation, Science & Sustainability: February 2024
Background Part of Wimmera Broadacre Net Zero Emissions Project (as Craig & Abdel have explained) Will continue on from Craig s description Why do this? - Important to estimate what reducing GHGs will do to regional economies in particular primary production while shifting towards less polluting technologies - Are alternative energies coming on stream and available? - What are the impediments to this? Structure: - Farm derived sample data, GHG Victoria inventory and national-state accounts used (4 regional IO Tables), - Method, - Findings, - Policy implications & further research 2/23/2025 2
Method: What the Data Tells Us - Report Tables 1 and 2 Table 1 (in report) reading down the columns shows in the longer term that the sheep, grains, dairy and beef cattle (S0101) sector balance is increasing as its GHGs are decreasing (also holds for 2013 to 2020) Table 2 shows relationship between sector balance and GHG emissions for all 114 main input-output national accounting sectors: - Columns 11 and 12 show that from 2017-18 to 2018-19 a GHG decrease of -3.69344 CO2 -e corresponds to a $1M increase for the sheep, grains, beef and dairy cattle sector balance - Possible reasons being: (1) Switching fuel sources, on-farm production methods and behaviours, (2) Price increasing when Qd falls causing price increases and subsequent revenue increase effects as TR = P*Qd Table 2 derived -3.69344 was used as foundation value for non-zero simulation of 2017-18 to 2018-19 because: (1) It matched the sample data year being 2017-18 and therefore on-farm practices, technologies and trade influences for 2017-18 only (2)A longer-term relationship was considered to place less emphasis on the most recent on- farm practices, technologies and trade patterns 2/23/2025 3
Method: What the Data Tells Us - Report Tables 1 and 2 Table 2 also lists related sectors being: - - - - - - Poultry and other livestock (102) Other agriculture (103) Aquaculture (201) Forestry and logging (301) Fishing hunting & trapping (401) Agriculture, forestry, hunting, trapping and fishing support services (501) S102, S103, S501 were also main beneficiaries of the simulations and more than often were in the top 5 performing sectors for each LGA 2/23/2025 4
Method: Table 3 Table 3: Sustainability converted to $M AUD equivalents - Shows sample-farm GHG usage data (collected by Craig) Centre for National sectors within Hindmarsh, Yarriabiack and Horsham & West-Wimmera LGAs respectively - Sample farms B, D, L & W represent the sheep, grains, beef & dairy cattle - Calculation 5 derives CO2 volumes to be removed (Net Direct Emissions) area only (based on Table 2 derived relationship) - Calculation 6 converts the calculation 5 values to $M equivalent increase for sampled farm LGA farmed area (hectares) (i.e. multiplies upwards) - Calculation 7 adjusts calculation 6 values to convert sample value to a value for whole of - All adjustments are shown in Table 4 - Hence $0.220291 M, $0.011631 M, $0.037715 M and $0.473047 becomes $8.46768 M, $3.77580 M, $11.93403 M, $142.035404M AUD for Hindmarsh, Yarriambiack, Horsham and West-Wimmera LGAs respectively 2/23/2025 5
Simulation Method We therefore increase Final Demand for the Sheep, grains, beef and dairy cattle sector in Hindmarsh, Yarriambiack and Horsham by - $8.46768 M, $3.77580 M, $11.93403 M, $142.035404 M respectively A special function command in the input-output software allows us to apply these increases to the input-Output economic models for Hindmarsh, Yarriambiack and Horsham respectively Economic impact is what results from this change in final demand Table 4 shows measured impact results, on main economic indicators for the Sheep, grains, beef & dairy cattle sector before and after sequestration - Sequestration is the capture of GHG by vegetation - It increases when boundary trees and crops are planted and decreases when these forms of vegetation are removed 2/23/2025 6
Method Assumptions Usefulness of this trend-based method assumes: - - Domestic and global consumption & trade patters be accompanied by continued substitution towards fuels that are lower in emission intensity as is also occurring (electricity generation shifting from fossil fuels to renewables over time) That 2018 global and domestic demand, quantity and price (that is, overall trade patterns will continue into future or become even more favourable for increased sector earnings) If this is the case, then sector earnings will increase while GHG volumes continue to decrease - If scope 1 direct emissions are reduced, then we can assume that Scope 2 and 3 indirect emissions will also decrease 2/23/2025 7
Simulation Method Table 5 shows what happens across whole regional LGA economy (every sector) in summary form: - Results for top 5 performing sectors and lowest 5 performing sectors are shown 2/23/2025 8
Net Zero Simulation - Results Summary Table 5 Shows that under the net-zero scenario, the sheep, grains, beef & dairy cattle sector is expected to grow for each of the four (4) LGAs (Report S10): - With farms achieving net-zero carbon emissions expected to have no substantial negative impact on any economic sectors nor on the overall economic activity - All economic variables (measures) increased their values (from those in Column 2 to value in Column 7) with total increases shown in Column 6 & percentage increases shown in Column 8 - Contribution of own sector industry support and consumption flow-on multipliers is also shown (Columns 3, 4 and 5 respectively) 2/23/2025 9
Net Zero Simulation Results Summary Table 6 Table 6 shows for all 4 LGA regional economies, a summary economic impact on all 114 sectors by illustrating the five (5) strongest and five (5) weakest performing sectors post carbon sequestration - Production outputs for all sectors increased (C2) - Sector employment (C10increased for all sectors) - Incomes (COE) and Profits (GOSMI) as shown in C3 and C4 respectively increased in value for / in all sectors - An exception was Library & Other Information Services (S6001) within the Hindmarsh weakest 5 category (due to an initial low multiplier value / relationship) - Nearly all taxation measures being taxes less subsidies on products (TLSP) and other taxes less subsidies on production (OTLSP) as listed in C5 and C6 respectively, increased for most sectors. 2/23/2025 10
Net Zero Simulation Results Summary Table 6 Some exceptions due to lower linkage / multiplier effect from the sector being adjusted (sheep, grains, beef & dairy cattle, S0101). These were: - Library & other information services (S6001) within Hindmarsh weakest 5 (TLSL, C5) - Heritage, creative & performing arts (S8901) within Hindmarsh weakest 5 (TLSP, C5) - Arts, sport, adult & other education services (S8201) within Yarriambiack weakest 5 (TLSP, C5) - Health care services (S8401) within Yarriambiack weakest 5 (TLSP, C5) - Residential care & social assistance services (S8601) within Yarriambiack weakwest 5 (TLSP, C5) - Heritage, creative & performing arts (S8901) within Yarriambiack weakest 5 (TLSP, C5) - Library & other information services (S6001) within Horsham weakest 5 (TLSP, C5) - Art, sport & other education services (S8201) within Yarriambiack weakest 5 (OTLSP, C6) 2/23/2025 - Residential care & social assistance services (S8601) within Yarriambiack weakest 5 (OTLSP, C6) 11
Net Zero Simulation Results Summary Table 6 Imports of goods (C7) increased for almost all sectors - An exception was Arts, sports, adult & other education services (S8201) within Yarriabbiack weakest 5, due to weaker multiplier / linkage effect from stimulated sector S0101) Imports of services (C8) increased for almost all sectors - Exceptions were (a) Arts, sport, adult & other education services (S8201) and (b) residential care and social assistance services (S8601), - Both were within the Yarriambiack weakest 5 due to weaker linkage multiplier effect from stimulated sector S0101. Value added (C9) increased for all sectors For those LGA sectors within the weakest performing category, some economic variables increased their contributions , but this measured < 1.0% of the whole variable (indicator) West-Wimmera presented some surprising results: - For top 5 performing sectors the increases in economic variable values were more than those in other LGAs - For the lowest 5 performing sectors, the economic variables showed no increase at the 5 decimal level, possibly due to stronger and lower linkage & multiplier comnnections respectively 2/23/2025 12
Net Zero Simulation Results Summary Table 6 In summary, all sectors in all 4 LGAs improved production outputs, related employment, incomes, profits, and value- added: - Changes to other sectors within each LGA occur as they absorb flow-ons generated by the zero GHG simulation to Sheep, grains, beef and dairy cattle sector (S0101) - Most other economic variables increased in contributions excepts the exceptions listed earlier - No unusual data movements or inexplicable results were obtained 2/23/2025 13
Net Zero Simulation Results Summary Table 7 Shows that for all sectors in all 4 LGAs, imports & exports of both goods and services have increased: - However, some sectors demonstrated very slight decreases in net-exports (i.e. exports less imports) for either their goods or services category - These do not include any of the 7 related agricultural sectors referred to in Report S6, and fall mainly within the lowest 5 performers of each LGA - Due in most cases, to their import component increasing slightly more than its corresponding export component due to very slightly multiplier s for those variables - This is not a concern as the relevant sector s labour earnings and profits for farmers, graziers, and businesses, that is COE and GOSMI respecetively, have all increased - In summary, there is no loss of incomes for any group of wage earners or producers 2/23/2025 14
Policy Implications & Future Research Results suggest that the sheep, grains, beef & dairy cattle sector has substantially improved performance in all LGAs without employment loss Other sectors benefitted from flow-ons absorbed into their production processes Main assumption was that the technology of the day was responsible for the sector s quantity & type of energy being sourced, its volume of emissions produced and sector balances These were influenced by domestic and global demand patterns Similar study to be performed for West-Wimmera LGA 2/23/2025 15
Policy Implications & Future Research Further analysis on a state wide basis from say 2013 to 2020 for all 114 sectors can verify if technology & fuel substitution (switching) processes and price effects are both at play and to what extent - Determine changes in fuel sourcing for both Australian and new UN systems which is more specific and detailed (decomposed particularly with agricultural emissions) - Reconcile) the two systems, - Technology and fuel sourcing multiplier changes should be determined - Relate energy sources to all 114 sector balances to emissions for each of the 114 sectors Some fuel sourcing and technology changes are industry specific that is they relate to either sheep, grains or say beef cattle production impacts may vary across regions depending upon the regions particular farming or production intensity Policy desires that such changes should continue and that those energy sources and technologies that produce lower GHG emissions become increasingly more readily available 2/23/2025 - What are the supply restrictions to these new energies and their sources? 16
Acknowledgements: Chris Sounness and the Wimmera Development Board References: Australian National Accounts: State Accounts 2016-17, 2017-18, 2018-19, Australian Bureau of Statistics, Australian National Accounts: Input-Output Tables, 2016-17, 2017-18, 2018-19, Australian Bureau of Statistics, Quarterly Updates of Australia s national Greenhouse Gas Inventory: June 2016, 2017, 2018, 2019, 2020, 2021, Australian Government, Department of Environment and Energy Victorian Greenhouse Gas Emissions Report, 2016, 2017, 2018, 2019, Victorian Department of Environment, Land, Water and Planning West G., (1993), Input-Output for Practitioners, University of Queensland Press 2/23/2025 17
Thank You 18