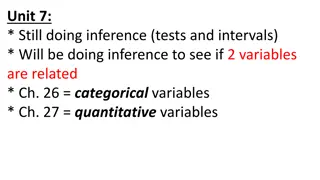
Genomic Inference of Human Population Size Changes Over Time
Explore the genomic inference of a severe human bottleneck during the Early to Middle Pleistocene transition, tracing the evolution of hominins over the last 4 million years, and studying essential events in the emergence of humans in the last one million years. Discover well-known human population size changes in the past 100,000 years and the significance of ancient DNA studies in dating Neanderthals and African human ancestors.

Genomic Inference of Human Population Size Changes Over Time
PowerPoint presentation about 'Genomic Inference of Human Population Size Changes Over Time'. This presentation describes the topic on Explore the genomic inference of a severe human bottleneck during the Early to Middle Pleistocene transition, tracing the evolution of hominins over the last 4 million years, and studying essential events in the emergence of humans in the last one million years. Discover well-known human population size changes in the past 100,000 years and the significance of ancient DNA studies in dating Neanderthals and African human ancestors.. Download this presentation absolutely free.
Presentation Transcript
Original version. Last modified by the authors on Oct 06, 2023 Genomic inference of a severe human bottleneck during the Early to Middle Pleistocene transition The slides were prepared by Fabio Di Vincenzo, University of Florence Giorgio Manzi, Sapienza University of Rome Yi-Hsuan Pan, Key Laboratory of Brain Functional Genomics, East China Normal University Haipeng Li, Shanghai Institute of Nutrition and Health, CAS. Pengyuan Du Wangjie Hu Ziqian Hao Fabio Di Vincenzo Giorgio Manzi The slides can be freely shared, re-distributed and modified. To avoid the mis-understanding, the modified slides should be properly marked. The paper can be downloaded via the link: https://www.science.org/doi/10.1126/science.abq7487 Jialong Cui Yun-Xin Fu Please include this link when sharing the slides and discussing the related questions online. Yi-Hsuan Pan Haipeng Li
Hominin evolution during the last 4 million years H. rhodesiensis H. sapiens Chimpanzee H. erectus Denisovans 0 H. floresiensis H. naledi Million years ago P. robustus 1 P. boisei H. ergaster H. antecessor H. neanderthalensis H. habilis A. sediba 2 Dmanisi H. rudolfensis P. garhi H. heidelbergensis Ledi Geraru A. afarensis 3 P. aethiopicus K. platyops A. africanus A. deyiremeda 4 A. bahrelghazali A. anamensis Homo Paranthropus Australopithecus Modified from de Sousa, et al. (2023) Communications Biology 6:636 Source: pixabay.com
The last one million years essential for the emergence of humans H. rhodesiensis H. sapiens Chimpanzee H. erectus Denisovans 0 H. floresiensis H. naledi Million years ago P. robustus 1 P. boisei H. ergaster H. antecessor H. neanderthalensis H. habilis A. sediba 2 Dmanisi H. rudolfensis P. garhi H. heidelbergensis Ledi Geraru A. afarensis 3 P. aethiopicus K. platyops A. africanus A. deyiremeda 4 A. bahrelghazali A. anamensis Homo Paranthropus Australopithecus Modified from de Sousa, et al. (2023) Communications Biology 6:636 Source: pixabay.com
Well-known human population size changes in the last 100 thousand years Data from Luca Cavalli-Sforza & Feldman (2003) Nature Genet GS(2016)2962
Ancient DNA of Neanderthals in Europe dated 38 44 thousand years ago Ancient DNA of African human ancestors dated 300 thousand years ago? GS(2020)4391 Green et al. (2010) Science 328:710-722
A new method needed to infer population size history one million years ago (Analogous to the effective range of a gun) (0.1 million years) 100m (1 million years) 1,000m
Coalescent tree / evolutionary tree The most recent common ancestor (MRCA) Millions of years ago t2 Backward in time t3 t4 t5 at present
Coalescent tree / evolutionary tree Observed SFS = (7, 4, 1, 0) The most recent common ancestor (MRCA) Millions of years ago t2 Backward in time t3 t4 t5 at present Singleton mutations ( = 7) 1 Doubleton mutations (= 4) 2 (= 0) 4 Tripleton mutations (= 1) 3
How to infer population size history from SFS (1) UK samples 3 individuals (or 6 genomes) Site frequency spectrum (SFS) Obs. SFS Expected values 10,000 Number of mutations Model 01 for population size history singletons Observed number of doubletons 5,000 Population size Exp. SFS 0 SFS types Present Past The model was rejected because expected SFS and observed SFS are un-matched.
How to infer population size history from SFS (2) UK samples 3 individuals (or 6 genomes) Site frequency spectrum (SFS) Obs. SFS Expected values 10,000 Number of mutations Model 02 for population size history singletons Observed number of doubletons 5,000 Exp. SFS Population size 0 SFS types Past Present The model was accepted because expected SFS and observed SFS are matched.
The expected branch length ???(?())of type ? ? ?+1 ? ? 1 ? 2 ? 1 ? 1 2?(?)??(?)?d? 0 ?=2 ?(?): The effective population size at time t : The probability of state l at time t ??(?) : The number of chromosomes sampled ?
Composite likelihood function ? 1?? ??? ?? ??! ??,?(? ,?( )) = ?=1 ? = (??): The observed site frequency spectrum ??: The number of mutations of the same size i in the sample ? : The population size history ??: ? ???(?( )) : The length of sequences
Simulation- and FitCoal-based likelihood graph Simulation-based FitCoal-based
Population size histories inferred by FitCoal, PSMC, Stairway Plot, and SMC++ using simulated samples Time (thousand years ago) Time (thousand years ago) Li & Durbin (2011) Nature Liu & Fu (2015) Nature Genet Terhorst et al. (2017) Nature Genet
Public population genomic data set (1) 1000 Genomes Project (1000GP) 7 African populations, and 19 non-African populations 172 226 genomic sequences per population Low coverage in non-coding regions (~5X) GS(2016)2962 Sampling locations adopted from Altshuler, et al. (2015) Nature
Public population genomic data set (2) HGDP-CEPH 3 African populations, and 21 non-African populations 32 - 92 genomic sequences per population High coverage (~35X) GS(2016)2962 Sampling locations adopted from Bergstrom et al. (2020) Science
African population size history 1000GP HGDP-CEPH African European Middle East East Asian South Asian American 1,300 1,270 Ancient population survey
FitCoal-inferred population size histories of small African samples Bergstrom et al. (2020) Science
FitCoal-inferred population size histories of African (YRI) subsamples YRI: Yoruba in Ibadan, Nigeria GS(2020)4391
The ancient severe bottleneck detected in 19 non-African populations in 1000GP using the extended FitCoal Ancestral Ne 103,390 vs 98,130 Start time of the bottleneck (in thousand years BP) 921 vs 930 Ne during the bottleneck 1,450 vs 1,280 End time of the bottleneck (in thousand years BP) 785 vs 813 (non-African vs African)
The severe bottleneck congruent with the African fossil gap The duration of the ancient severe bottleneck
Summary (1) LCA: the last common ancestor shared by Denisovans, Neanderthals, and modern humans
How to change the fate of extinction? Summary (2) Time (kyr) 930 One population (a community Isolated populations with a shared future of mankind) Less than 1,280 breeding individuals ~ 1,280 breeding individuals Sensitive to environmental changes Robust to environmental changes
Summary (3) It s a 10-year project, most of our time is to develop FitCoal and validate the bottleneck ~ one year ~ one year ~ six months The first version of the theory and software (discarded) The second version of the theory and software (useful) FitCoal ~ six months (Most efforts were paid to identify errors ) Data analysis Download VCF Calculate SFS Infer pop size history Debug program (1000GP and HGDP-CEPH) and confirm the results ~ seven years (Validation for the ancient severe bottleneck) Africa vs nonAfrica FitCoal vs other four Obs. vs expected SFS FitCoal vs Z.W. Reviewer extended FitCoal Ancient introgress. Cross check Min- sample Population structure Selection Speciation Climate changes & 0.9 Ma event Chromosome fusion African fossil gap Control of fire
Summary (4) It s a 10-year project, most of our time is to develop FitCoal and validate the bottleneck All modern humans are the descendants of the ancient small population There were about 1,280 human breeding ancestors lived 900 thousand years ago. The ancient severe bottleneck was likely caused by climate changes Our ancestors may be united to fight against harsh environments and have succeeded The ancient severe bottleneck may have accelerated the evolution of human ancestors and the speciation process, and thus make us unique to other archaic hominins Molecular clock does not change the existence of the ancient severe bottleneck It is important for population genetics and paleontologists to collaborate in the future
Why us? 1) Our team is highly efficient, and we act as one.
Why us? 1) Our team is highly efficient, and we act as one. 2) The analytical formulae of the expected branch lengths are obtained, and 10 8or10 11 computational accuracy reaches . 0.1 10,000 10,000 Number of mutations Expected number of mutations (Model 2) Expected branch lengths (Model 2) 0.05 5,000 5,000 Observed number of mutations 0 0 SFS types SFS types
Why us? 1) Our team is highly efficient, and we act as one. 2) The analytical formulae of the expected branch lengths are obtained, and 10 8or10 11 computational accuracy reaches . 3) FitCoal treats both recent and ancient time fairly. Present Past E=MC E=MC FitCoal No pre-defined time blocks, unbiased for the inference of recent and ancient history PSMC (Li & Durbin, Nature 2011, Vol 475:493-496), SMC++ (Terhorst et al., Nature Genet 2016, Vol 49:303-309) Short time blocks, friendly for recent history inference Long time blocks, un-friendly for ancient history inference
Why us? 1) Our team is highly efficient, and we act as one. 2) The analytical formulae of the expected branch lengths are obtained, and 10 8or10 11 computational accuracy reaches . 3) FitCoal treats both recent and ancient time fairly. 4) Both exponential and instantaneous changes are allowed within each inference time interval of FitCoal. Two inference time intervals Two inference time intervals
Why us? 1) Our team is highly efficient, and we act as one. 2) The analytical formulae of the expected branch lengths are obtained, and 10 8or10 11 computational accuracy reaches . 3) FitCoal treats both recent and ancient time fairly. 4) Both exponential and instantaneous changes are allowed within each inference time interval of FitCoal. 5) We focused on present-day human genomic sequences. Genomic sequences of humans (1,000 thousand years) (~960 thousand years) Genomic sequences of Neanderthals (dated 38 44 thousand years ago)
How to cite and download the paper How to cite: Wangjie Hu, Ziqian Hao, Pengyuan Du, Fabio Di Vincenzo, Giorgio Manzi, Jialong Cui, Yun-Xin Fu, Yi- Hsuan Pan, Haipeng Li (2023) Genomic inference of a severe human bottleneck during the Early to Middle Pleistocene transition. Science 381, 979-984. (https://www.science.org/doi/10.1126/science.abq7487) How to download the paper: For most researchers, it can be obtained via https://www.science.org/doi/10.1126/science.abq7487 A free published paper can be obtained by visiting Dr. Yi-Hsuan Pan s website (https://faculty.ecnu.edu.cn/_s14/pyx_en/main.psp). Click Academic Achievements, and search severe human bottleneck . You should be able to find a link to download the published paper for free. The free link is provided by the journal (with an author token), so please DO NOT share the link publicly. It can only be accessed by visiting Dr. Yi-Hsuan Pan s website. Green open access (the accepted manuscript) is also available (with permission of the AAAS) via https://www.researchgate.net/publication/373553749_Genomic_inference_of_a_severe_human_bottleneck_during_the_Early _to_Middle_Pleistocene_transition
Acknowledgement We would thank the following funders: National Natural Science Foundation of China, Chinese Academy of Sciences, National Key Research and Development Project, National Institutes of Health, Education Bureau of Jinan and Shandong First Medical University, Key Laboratory of Brain Functional Genomics at East China Normal University, Shanghai Institute of Nutrition and Health, China Postdoctoral Science Foundation, Shandong Provincial Natural Science Foundation, and Shandong Provincial Postdoctoral Innovation Talent Support Program.


")
")
")
)of type ?")


")
")


")


")
")
")
")