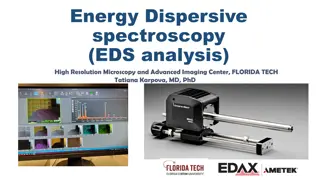
Procedure for Quantifying Interlaminar Damage in Refractory Composites Using Micro-X-Ray CT
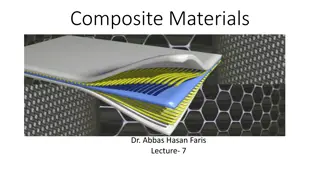
This study presents a method to quantify interlaminar damage in refractory composites through in-situ micro-X-ray computed tomography. The procedure aims to capture the progressive failure in ASTM-sized specimens, providing empirical data for improving simulations of composite materials. Various specimen types and testing procedures are outlined, emphasizing the need for enhanced empirical observations to enhance material property predictions at the unit cell level.

Procedure for Quantifying Interlaminar Damage in Refractory Composites Using Micro-X-Ray CT
PowerPoint presentation about 'Procedure for Quantifying Interlaminar Damage in Refractory Composites Using Micro-X-Ray CT'. This presentation describes the topic on This study presents a method to quantify interlaminar damage in refractory composites through in-situ micro-X-ray computed tomography. The procedure aims to capture the progressive failure in ASTM-sized specimens, providing empirical data for improving simulations of composite materials. Various specimen types and testing procedures are outlined, emphasizing the need for enhanced empirical observations to enhance material property predictions at the unit cell level.. Download this presentation absolutely free.
Presentation Transcript
A Procedure to Quantify Interlaminar Damage in Refractory Composites by In-Situ Micro-X-Ray Computed Tomography Bryan A. Kubitschek NASA Langley Research Center, Hampton, VA 23681, USA Bryson A. Marretta Analytical Services & Materials, Hampton, VA 23666, USA AIAA SciTech, 8-12 January 2024, Orlando Florida 1
Outline Introduction Test setup Data processing Concluding remarks 2
Introduction Composite material maturation into a flight component is a lengthy and expensive process Developing models to predict material properties requires improved empirical data at the unit cell level Material databases will require fewer empirical tests if a feedback loop between a model and empirical observations can be improved 3
Introduction, continued Goal Collect empirical data on the progressive failure of refractory composites to improve current simulations. Objective Develop a procedure to capture the progressive failure in ASTM-sized specimens throughout volume of the specimen. Approach Test and observe specimens utilizing a load frame located within a micro-x-ray computed tomography (CT) machine in an iterative manner. 4
Specimens Interlaminar Shear (ILS) Double Notch Shear (DNS) ASTM D3846 3.12 in. x 0.49 in. 0/903s warp align 8-Harness Satin Weave (HSW) Gage area 0.169 in Flat-wise interlaminar tension (ILT) ASTM D7291 1.0 in. x 1.0 in. 0/903s warp align 8-HSW Gage area 0.99 in 5
Specimens, continued Curve-Beam Interlaminar Tensile (CB-ILT) ASTM D6415 0/60/ 60/0/60/ 60s warp align 8-HSW SiC Coating 6
Outline Introduction Test setup Data processing Concluding remarks 7
Test Stand Schematic Materials used in the vicinity of the beam are x-ray friendly Load frames are bolted to the CT platen Tests were loaded incrementally by hand Interface 1201-BJ 10 Kip load cell Interface model 9840 data acquisition system 9
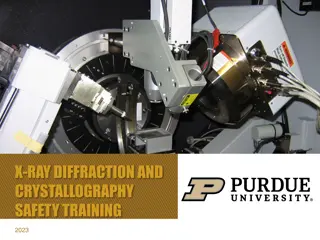
X-Ray Scan Configuration North Star Imaging (NSI) X3000 CT machine with Varian detector Voxel resolution Minimum voxel resolution for feature detection CT Scan Parameters Platen Left/Right (in.) Platen Up/Down (in.) Detector Up/Down (in.) Platen Magnitude (in.) Detector Magnitude (in.) Voltage (kV) Current ( A) Rotation Speed (degrees/s) Test 80 180 1.8 0 -2.957 0 2.638 39.370 ILS 80 180 1.8 0 -11.430 0 5.598 39.370 ILT CB-ILT 60 180 1.8 0 -11.600 0 6.900 39.370 CT Technique Parameters Frame Averaging (Count) 5 5 5 Range of Scan (degrees) 48 118 68 Voxel Resolution (in.) 3.35E-05 2.46E-05 8.50E-04 Minimum Voxel Resolution Feature Detectability (in.) 5.02E-05 1.40E-04 3.40E-03 Test Projection (Count) Delay (seconds) ILS ILT 330 840 800 1 1 1 CB-ILT 10
Outline Introduction Test setup Data processing Concluding remarks 11
Image Filtering All ILT data required image filtering before performing an image analysis Conducted adaptive Gaussian function A lowpass filter - focuses on the attenuation of grayscale intensity Linear - replaces the voxel with a weighted summation of the value from its surrounding neighbor Standard deviation in the grayscale value decreased 13.8% with the addition of the filter 12
Directional Variability Quantifies the uniformity of the grayscale value throughout the volume of the reconstruction A) CT slice of the ILT baseline scan X-directional variability of grayscale value Y-directional variability of grayscale value Z-directional variability of grayscale value B) C) D) 13
Directional Variability, continued Used grayscale deviation for region of interest (ROI) placement for ILT analysis XY grayscale variability analysis heat map Aspire to have the ROI mean and standard deviation (SD) grayscale value be close to the baseline scan Baseline Scan ROI 1 ROI 2 X-Direction 117.86 3.8 347 0.4 3.22 Y-Direction 117.65 1.04 349 0.11 0.88 X-Direction 126.45 19.46 344 2.06 15.39 Y-Direction 122.25 20.97 343 2.22 17.15 X-Direction Y-Direction 100.67 2.38 231 0.31 2.36 Mean 114.92 3.11 231 0.4 2.71 Standard Deviation Count 95% Confidence Interval Mean Covariance, % 14
Porosity Analysis Used VGStudioMax porosity inclusion analysis to capture pores and damage 15
Sources of Uncertainty While an uncertainty quantification has not yet been completed, identifying the sources is the first step 16
Outline Introduction Test setup Data processing Concluding remarks 17
Concluding Remarks Developed a procedure to capture the progressive failure in ASTM-sized specimens throughout volume of the specimen Discussed the details on CT test stand configuration Created a micro-x-ray CT configuration CT Scan Parameters CT Technique Data processing Image filtering Directional variability Porosity analysis Sources of uncertainty 18
Acknowledgements Support was provided by: NASA Langley Structural Mechanics and Concepts Branch 19