Cape Winelands District Overview and Economic Impact
Situated in the Western Cape, the Cape Winelands District is known for its agricultural diversity, cultural heritage, and economic significance. With a growing population, the district faces challenges in providing services to rural areas. The economy, driven by agriculture and tourism, saw a contraction during the COVID-19 pandemic, impacting job opportunities. Despite challenges, the district remains a key contributor to the province's economy.

Cape Winelands District Overview and Economic Impact
PowerPoint presentation about 'Cape Winelands District Overview and Economic Impact'. This presentation describes the topic on Situated in the Western Cape, the Cape Winelands District is known for its agricultural diversity, cultural heritage, and economic significance. With a growing population, the district faces challenges in providing services to rural areas. The economy, driven by agriculture and tourism, saw a contraction during the COVID-19 pandemic, impacting job opportunities. Despite challenges, the district remains a key contributor to the province's economy.. Download this presentation absolutely free.
Presentation Transcript
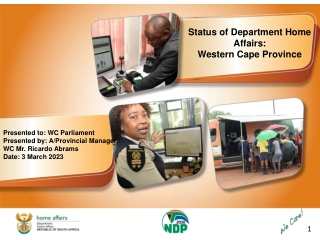
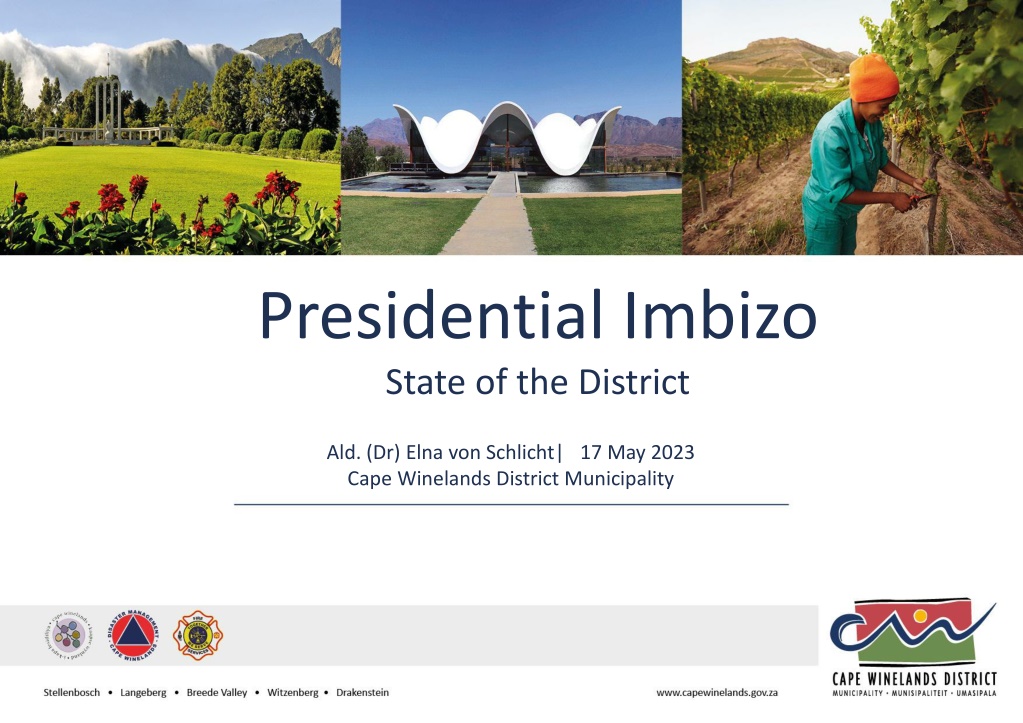
Presidential Imbizo State of the District Ald. (Dr) Elna von Schlicht| 17 May 2023 Cape Winelands District Municipality
Cape Winelands District 1. Introductory remarks 2. Cape Winelands District 2.1 Overview 2.2 Profile 3. Summary of CWDM JDMA Implementation Plan 4. Highlights and Areas of Support 4.1 CWDM 4.2 Breede Valley Local Municipality 4.3 Langeberg Local Municipality 4.4 Drakenstein Local Municipality 4.5 Stellenbosch Local Municipality 4.6 Witzenberg Local Municipality
Cape Winelands District Overview and Profile The Cape Winelands District, is situated in the lower central part of the Province and is bordered by the City of Cape Town, West Coast, Overberg and Central Karoo District Municipalities. The district is internationally known for its diverse agricultural produce, unique fauna and rich cultural history, which makes the district a popular tourist destination. The district covers an area of 21 473 km2, which consists of a combination of agricultural, developed urban areas and large stretches of mountainous land, joined by a network of well-maintained roads. Distances between rural establishments and necessary services is a large challenge for residents. The population of Cape Winelands District (CWD) stood at 968 667 in 2022 (44 people/km2). This is the most populated district in the Western Cape and is predicted to grow to 1 007 913 residents by 2025, this equates to an average annual growth rate of 1.3 per cent. The area is one of the pearls' of South Africa's rural and small-town subregions, but disparate with a relatively high and diverse level of development. The District is the second largest economic contributor to the Province, after the City of Cape Town. The district s economic drivers are largely dependant on its agricultural and related sectors, this being, wine, spirits and fruit development and export, as well as agri-, adventure and eco tourism. These sectors create the largest amount of job opportunities for both skilled and unskilled labour.
Cape Winelands District Overview and Profile, cont. In 2019, the economy of CWD was valued at R69.576 billion (current prices) and employed 395 234 people. Historical trends between 2015 and 2019 indicate that both the primary sector (-3.6 per cent) and secondary sector (-0.1 per cent) registered an average annual contraction over the reference period. In terms of sectoral contribution, the finance, insurance, real estate and business services (valued at R14.075 billion, with an average annual growth rate of 3.6 per cent) and the wholesale and retail trade, catering and accommodation (valued at R13.502 billion with an average annual growth rate of 2.1%) were the main drivers of growth from 2015 to 2019. These sectors were however unable to maintain their positive growth during the 2020 COVID-19 pandemic and related restrictions to economic activity. The CWD economy suffered a 5.5 per cent contraction with 21 550 net jobs lost as a result. The only sector that was able to maintain positive growth was the agriculture, fishing and forestry sector that grew by 10.9 per cent due to favourable commodity prices and little restrictions placed on the sector. The sector however experienced jobless growth as it still lost 3 443 jobs. Formal and Informal Employment: It is estimated that CWD s total labour force amounted to 373 684 workers in 2020 of which 277 948 (74.4 per cent) are in the formal sector while 95 736 (25.6 per cent) are informally employed. Formal jobs declined by 5.0 per cent from 2019 to 2020 while informal jobs declined by 6.8 per cent. This indicates that formal employment was more resilient against the economic shock brought about by the COVID-19 pandemic. Most of the formal labour force consisted of low-skilled (40.4 per cent) and semi-skilled (39.1 per cent) workers. The skilled category contributed 20.6 per cent to total formal employment and grew at an annual average rate of 1.1 per cent, while the semi-skilled and low- skilled categories grew at 0.5 and -0.9 per cent respectively from 2015 to 2019. Evidently, the demand for skilled labour is on the rise and more resilient to the effects of the COVID-19 pandemic due to these workers ability to work from home. This implies the need to capacitate and empower low-skilled and semi- skilled workers. Unemployment: The CWD (10.8 per cent) has the lowest unemployment rate in the Western Cape. The District s unemployment rate is based on the narrow definition of unemployment i.e., the percentage of people that are able to work, but unable to find employment.
Cape Winelands District Overview and Profile, cont. The Cape Winelands District (CWD) had a population of 968 667 in 2022, the most populated district in the Western Cape. This total is expected to grow to 1 007 913 by 2025, equating to an average annual growth rate of 1.3 %. There are less males than females in the CWD with a ratio of 49.3 %(males) to 50.7 %(females). The largest population growth projection was recorded in the 65+ aged cohort . This reflects possible improvements in life expectancy (an aging population) or that people are choosing the Cape Winelands as a retirement destination. The average size of households decreased from 3.8 in 2021 to 3.7 in 2025.
Cape Winelands District Overview and Profile, cont. Learner enrolment in the CWD increased from 146 495 enrollments in 2018 to 150 125 in 2020, increasing at 1.2% per annum The learner-teacher ratio reflected a slight decrease from 27.9 in 2018 to 27.8 in 2020. This is below the National guideline of no more than 40 learners per class. The learner retention rate declined from 69.4 per cent in 2019 to 67.2 per cent in 2020. The CWD has the lowest learner retention in the Province. The CWD smatric pass rate was 77.5% in 2022 and 2 of the top 3 learners in the country are from schools our district.
Cape Winelands District Overview and Profile, cont. In 2020/21, the CWD area had 72 primary healthcare clinics, comprising of, 39 fixed clinics, 33 satellite and mobile clinics, supported by 5 community day centres; 4 district hospitals and 2 regional hospitals. The CWD area has 2 Provincial (EMS) ambulances per 10 000 people in 2020/21 The Cape Winelands total registered patients receiving antiretroviral treatment 32 949 patients a decline of 3 434 compared to 2019/20. The immunization rate is low within the District, having declined from 63.1 per cent in 2019/20 to 60.6 per cent in 2020/21 and is particularly a challenge within the Stellenbosch municipal area (55.1 per cent). The neonatal mortality rate (per 1 000 live births) in the Cape Winelands area also deteriorated from 9.3 in 2019/20 to 10.7 in 2020/21, The number of malnourished children under five years (per 100 000) in District in 2020/21 was 1.8, a slight improvement from the 3.3 in 2019/20. The low-birth- weight rate however saw a slight increase from 15.1 per cent to 15.5 per cent. The maternal mortality rate in the CWD recorded 42.7 deaths per 100 000 live births in 2019/20 and increased to 118.3 by 2020/21, this can be attributed to Covid-19). The delivery rate to women under 20 years in the CWD decreased by almost 2% from 15.1 %in 2019/20 to 13.6&% in 2020/21. The termination of pregnancy rate declined from 0.8 per cent in 2019/20 to 0.7 per cent in 2020/21
Cape Winelands District Overview and Profile, cont. With a total of 234 696 households in the CWD municipal area, 80.8 per cent had access to formal housing. This is higher than the Western Cape average of 79.0 per cent. The area also had a lower proportion of informal households, a total of 18.0 per cent compared with the Western Cape average of 20.0 per cent. Service access levels within the municipal area: Access to piped water inside/within 200m of the dwelling at 97.0 per cent, Access to a flush or chemical toilet at 91.0 per cent, Access to electricity (for lighting) at 92.3 per cent, and The removal of refuse at least weekly by local authority at 79.4 per cent of households. Municipalities also provide a package of free basic services to households who are financially vulnerable and struggle to pay for services. The number of households receiving free basic services in the CWD has shown a generally increasing trend up to 2019. Approximately 19.5 per cent of households have access to free basic services within the District. The stressed economic conditions have exerted additional pressure on household income levels, which has likely increased the demand for free basic services and in turn the number of indigent households.
Cape Winelands District Overview and Profile, cont. The actual number of murders decreased from 398 in 2019/20 to 365 in 2020/21. Sexual Offences include rape, sex work, pornography, public indecency and human trafficking. In 2020/21, there were 752 reported sexual offences in the CWD area compared to 969 in 2019/20. Drug-related incidences within the CWD area decreased sharply from 11 181 cases in 2018/19 to 5 337 cases in 2020/21. When considering the rate per 100 000 people, at 559 cases per 100 000 people in 2020/21 The number of cases of driving under the influence of alcohol or drugs in the CWD area shows a significant decline from 944 in 2019/20 to 427 in 2020. This is largely attributed to COVID-19 related restrictions to movement and the sale of alcohol. The number of road user fatalities increased from 206 in 2019/20 to 211 in 2020/21. This was resultant from 167 fatal crashes. The number of residential burglaries in the CWD area decreased by 17.8 per cent from 5 518 in 2019/20 to 4 537 in 2020/21. The District s rate of 475 per 100 000 population was markedly higher than that of the Province (382 per 100 000 population). It is positive to note that all the above-mentioned categories of crime have declined in 2020/21 and is largely a consequence
Cape Winelands District Overview and Profile, cont. Spending on social infrastructure aids in social development and has the spill- over effect of enabling economic growth. The Western Cape Government (WCG) will spend 36.1 per cent of its 2021/22 infrastructure budget (R427.395 million) for the CWD area on social infrastructure. 6.0 per cent of the budget (R71 million) towards Education within the District area. 7.3 per cent (R86.671 million) has been allocated by the Department of Health for health infrastructure spending in the Cape Winelands region. The remainder of WCG social infrastructure spending (22.8 per cent or R269.724 million) has been allocated towards Human Settlements which will go a long way towards reducing housing backlogs in the District. The CWD municipalities have collectively allocated 14.2 per cent (R149.101 million of their 2021/22 capital budgets) towards social infrastructure. R29.489 million towards housing, R61.251 million towards sports and recreation, R13 994 million towards social development, and R36 000 towards health.
Cape Winelands District Overview and Profile The CWD municipalities have as such allocated R44.33 million of the collective capital budget to public safety. The WCG allocated R755.148 million (63.9 per cent in 2021/22) towards economic infrastructure, more specifically towards transport and public works. This was met with a R218.720 million allocation from the Cape Winelands municipalities towards road transport. The municipalities have also allocated R6.737 million towards environmental protection and R87.096 million towards planning and development. The majority of the Municipalities infrastructure budget i.e., 49.2 per cent or R517.052 million is allocated towards the provision of basic services. Spending on trading services have been allocated towards The majority on electricity (R176.237 million), which is positive to note in light of Eskom s electricity supply challenges. Water management (R163.147 million), Waste-water management (R126.135 million) also received significant allocations due to the recent droughts and aging infrastructure, and Waste management was allocated the remaining R51.533 million.
Overview: CWDM One Plan (JDMA) The Western Cape Government introduced the JDMA in November 2018. As the JDMA was already institutionalized in the Province, the Provincial Cabinet endorsed the JDMA as a Western Cape approach towards the National District Development Model (DDM). The JDMA is a geographical and team based, citizen focused approach with a Single District Plan to facilitate developmental initiatives and government services. The District developed its own Single District Plan . The plan firstly consists of strategic/catalytic projects that will positively impact on the strategic and economic trajectory within the CWDM geographical space; and Secondly, operational projects that aims to strengthen and improve the systems, processes, and operations in a municipality. In combination, these projects will inform the Single District Plan The CWDM JDMA Plan forms the basis of all developments for the future and will guide planning, budgeting and implementation over the medium to longer term. It was agreed between CWDM Political Principals and Senior Officials within the District that the JDMA Plan will be developed from the bottom-up, across the three spheres.
Overview: CWDM One Plan (JDMA) The following strategic and planning priorities were addressed in developing the CWDM District Plan: Climate Change / Water Security Local Economic Development Waste Management Political, Administrativ e and Social Instability Immigration / Urbanisation Strategic Priorities Citizen Interface Infrastructure Management Financial Sustainability Institutional Governance Partnering / Data Partnerships/ Management Shared Services Intergov Planning Alignment
CWDM One Plan: Priority Focus Area and Projects Community Safety: District Plan Community Safety: Area-based safety plan Community Safety: SANTAM support (fire and IT equipment, PPE and smoke alarms) Economic Recovery and unemployment: Economic Recovery Plan implementation Resource Resilience: Climate Change, Water Management & Wildfire Urban Interphase risks Resource Resilience: Municipal Energy Resilience Urbanisation: Develop a guide to inform future developments Urbanisation: Transhex, Vredebes, Vlakkeland: Monitor mega human settlement projects to inform Guide Urbanisation: Kluitjieskraal: Address Land invasions Urbanisation: Provision of Basic Services for Prioritised Informal Settlements through additional Grant co-funding from DLG
CWDM One Plan: Priority Focus Area and Projects Existing Projects New projects: Community Safety: District Plan , Area-based safety plan and SANTAM support (fire and IT equipment, PPE and smoke alarms) Business Sustainability: Digital Transformation Strategy Shared Service project extension to include Vehicle and Animal impounding Economic Recovery and unemployment: Economic Recovery Plan implementation Resource Resilience: Climate Change, Water Management & Wildfire Urban Interphase risks; Municipal Energy Resilience Waste minimization: Solid Waste Transfer Site Urbanisation: Develop a guide to inform future developments; Transhex, Vredebes, Vlakkeland: Monitor mega human settlement projects to inform Guide; Infrastructure development: management and Kluitjieskraal: Address Land invasions Heightening Brandvlei Dam Provision of Basic Services for Prioritised Informal Settlements through additional Grant co-funding from DLG Touwsrivier and De Doorns Flooding
Overview: Cape Winelands District Municipality Budget for 2023/2024 financial year = R 475 million Fire Services, Municipal Health Services, Roads, Local Economic Development, Disaster Management, etc.
Highlights: Cape Winelands District Municipality Jobs Inter-governmental Relations Mutual aid agreement with Local Municipalities for Fire and Rescue Services Ongoing support and funding to enable the retention and expansion of Tourism and Local Economic Development Municipal Health Services for the whole of the Cape Winelands District More than 12 000 work opportunities created in 2021/2022 (last audited financial year) Private Sector Involvement a) Partnership with Santam & SASRIA Multi-million investment over 3-year period (2019 - 2022) Risk reduction PPE, smoke alarms, various types of training, media campaigns Multi-purpose centre youth upliftment & training programmes successfully implemented from here Good Governance 9th consecutive clean audit for the 2021/2022 financial year b) Road Maintenance and Upgrades Collaboration with landowners Demonstrates balance between compliance and service delivery Waste Management Landfill site in planning for eastern side of the CWD Breede Valley, Witzenberg & Langeberg Budget in total = approximately R 100 million Waste minimisation and diversion plans funded for the whole of the Cape Winelands District
Areas of Support: Cape Winelands District Municipality Loadshedding Negative impact on economy, health, social well-being, increase in crime, etc. Roads State of certain roads does not contribute to economic growth Example transport of grapes to port for export, arrives crushed and not viable for exports any longer Legislation Very restrictive - hampers service delivery Could lead to not always obtaining best value for money Specific reference to SCM legislation a lot of red tape Financial Sustainability District Municipality requires MIG funding, specifically now with building of regional landfill site Different funding model required for District Municipalities (RSC levies received vs RSC Levy Replacement grant)
Overview: Breede Valley Location advantage: Positioned near 2 major routes (N1 and R60) to the North and Southern Cape and Johannesburg for transporting produce and commuters and plays a role in terms of tourism. Further expansion of 20 megalitre reservoir to address water security challenges. Significant funding allocated to resealing and upgrading of roads to systematically address all identified roads. Zwelethemba (previously disadvantaged area) Swimming pool funded entirely from municipal budget and also reduces the risk of children having to walk into town to use pool. Furthermore, the Municipality is augmenting its sewerage networks in hotspot areas within Rawsonville, Avion Park, Riverview, Zwelethemba and Roodewal
Highlights: Breede Valley Location advantage: Positioned near 2 major routes (N1 and R60) to the North and Southern Cape and Johannesburg for transporting produce and commuters and plays a role in terms of tourism. Further expansion of 20 megalitre reservoir to address water security challenges. Significant funding allocated to resealing and upgrading of roads to systematically address all identified roads. Zwelethemba (previously disavantaged area) Swimming pool funded entirely from municipal budget and also reduces the risk of children having to walk into town to use pool. Furthermore, the Municipality is augmenting its sewerage networks in hotspot areas within Rawsonville, Avion Park, Riverview, Zwelethemba and Roodewal
Areas of Support: Breede Valley Consistent growth in population and settlement patterns demands the need for more sustainable economic opportunities to accommodate amongst other, the TRANSHEX human settlement development. BVM recognizes its constitutional mandate as an enabler in this regard and has subsequently positioned itself to expedite the development of two additional industrial parks within the next 5 to 20 years (medium- to long term). The envisaged park depicted in this presentation (Uitvlugt) is the larger of the two and will require greater capital investment and stakeholder collaboration to enhance the attainability of the project and attract potential investors. The parks anticipated contribution to employment and economic opportunities, can t be underestimated. Though we recognize that this project will only materialize over a longer timeframe, we are proactively augmenting our current infrastructure capacity (specifically water provision) to ensure that we are favourably positioned to service future service needs within the park through the N1 Eastern Bypass
Highlights: Langeberg Tourist destination with lots of activities to do in our area Maintained a collection rate of 95% and higher for past 5 years Maintained clean audits for past consecutive 4 years Functioning Council with regular Council meetings despite Coalition all parties work together Functioning Public Participation system that includes Ward committees operational in all 12 wards Functioning governance structures e.g. MPAC, audit committee
Highlights: Drakenstein Governance Performance Index South Africa, 2021: Ranked 14th out of 205 municipalities. Top ranked secondary city in the Western Cape and rated third nationally. Number Three (3) secondary city in South Africa, by research and advocacy non- profit organisation Good Governance Africa (GGA). Drakenstein received 2 awards at the 2023 Service Excellence Award Ceremony in the categories: Best Municipality 2023: Silver Award Best Municipal Project 2023: Top 5 Special Recognition
Areas of Support: Drakenstein Negative effect of loadshedding on revenue, economic growth, and damage to infrastructure Growing urbanisation leading to informal settlements and illegal electricity connections Lower equitable share in comparison to other comparable secondary cities 61% of our residents are indigent Declining job opportunities due to foreigners in the agricultural sector Electricity reticulation in Saron, Hermon and Gouda - transfer from Eskom to Drakenstein
Highlights: Stellenbosch Project Description Single biggest capital expenditure in the history of the Stellenbosch municipality with a total construction value estimated at R479 million. The project was funded by the Stellenbosch Municipality and the Department of Water and Sanitation (DWS) through its Regional Bulk Infrastructure Grant (RBIG) initiative. This is the largest ultrafiltration membrane biological reactor WWTW in South Africa. The plant is capable of handling up to 35 M per day (average dry weather flow). The facility is fully automated, allowing it to be monitored, recorded and controlled via a centralised Supervisory Control and Data Acquisition (SCADA) system. High odour generation areas on the plant were equipped with an advanced odour treatment system, thus mitigating any odour nuisances from the plant. Stellenbosch Wastewater Treatment Works (WWTW) Construction of the new Distillery Road Bridge, Rehabilitation of Roadways and Ancillary Works The Distillery Road bridge crosses the Plankenbrug River and serves as the only public access road to Bosman s Crossing, a small mixed-development community within Stellenbosch. The location of the bridge holds historical significance since the original bridge was constructed in 1691 and was the first formalised entrance from the Cape to Stellenbosch along the old Cape wagon road, with the last bridge upgrade dating back to the mid-20th century. ATC was identified as a catalytic project in the MSDF (2019). A Local Spatial Development Framework (LSDF) for the ATC was approved by Council. The Department: Development Planning is currently finalising the Institutional Arrangements (which include the ATC Project Management Unit) to enable the implementation of the projects within the ATC. Adam Tas Corridor (ATC)
Areas of Support: Stellenbosch Project Description The identified property is 15.5ha in extent of which the municipality requires 8ha for residential purposes. In 2020, a Cabinet Resolution was released that all state land suitable for human settlements be released by way of Power of Attorney (PoA)to Housing Development Agency in order for development to be pursued. PoA was issued, awaiting the transfer of Erf 64, Kylemore to the Stellenbosch Municipality. The Housing Development Agency (HAD) has submitted a Project Initiation Document (PID) funding application to the PDoHS. The funding application is currently being evaluated by PDoHS. The project is ongoing. Erf 64 (Kylemore) The Executive Mayor has requested a meeting with the National Minister of Public Works and Infrastructure to address the challenges facing Jonkershoek and Forestry Villages. The municipality is waiting for a response from the National Minister of Public Works and Infrastructure s office. Jonkershoek The application has been submitted to the Department: Land Use Planning, for approval. Internal, linked and bulk services are required to the value of R5,7 million. Maasdorp Village Ownership of the property currently vests with the National Department of Public Works (NDPW). The Department of Public Works and Infrastructure (DoPW&I), as custodians of the relevant portions of land, has been engaged to commence with the necessary procedures that would lead to the transfer of the subject properties into the name of Stellenbosch Municipality, for housing development purposes. Linked and bulk services remains a critical challenge as no funding is available. Meerlust
Highlights: Witzenberg Revenue increased from 83% during Covid to 93% current with target at 95%. Eskom supplying towns remains major contributors to outstanding debt. Municipal budget is funded but with threats of sustainability over MTREF period mainly as a result of outstanding debtors and increased operational costs. Capital expenditure has restored from 45% in 2019/20 (COVID-19) to 90% in 2021/22 & expecting 94% this year. Providing Indigent Subsidy to 3155 beneficiaries (2 options: 100% - < R 3500 & 50% of R 3500 to R 5000) 10th consecutive clean audit Water/Sanitation Green drop for 3 of 4 systems with Tulbagh 2nd best national Blue drop for all system (previous evaluation, awaiting current results Water losses below 15% for past 3 years
Areas of Support: Witzenberg In the Witzenberg municipal area the activities around towns are essentially agriculture based, with the towns being agricultural service centres , with major Agri-processing as well, related to wine, fruit, vegetable and other niche products. Witzenberg is a major production area for fruit - 30% apples, 26% peaches, 52% nectarines & 55% cherries - % of national production areas in ha. Majority packed for export market, processed well known Ceres fruit juice brand The AgriParks infrastructure investments 2014/18 - +R100m unlocked various private investments, economic growth & job creation. Under capacity of Eskom bulk supply lines to area Engagements since 2015 to increase notified maximum demand accommodate growth economically & socially (low-cost housing) Eskom keeps on shifting goal posts (promises) latest can only upgrade bulk supply line in 2030 Moratorium on all new developments agricultural, industrial, social (1200 serviced sites for subsidised housing completed can not be occupied - vandalised) Penalties for municipality when notified maximum demand is exceeded With an annual population growth of 2,2% (Cape Winelands / Western Cape at 1,4%), which mainly consist of immigrating poor job seekers, the natural resources, financial viability and social environment are under severe pressure. The growth in informal settlements and land invasions, especially in small, low potential towns, has increased well beyond municipal control and financial capacity to provide basic services. Review of Housing policy especially in terms of Incremental Housing
Alderman (Dr) Elna von Schlicht 17 May 2023


")
")


 Elna von Schlicht")