BI Platforms Fail to Empower Non-Technical Users — Here’s How to Change That
Most Business Intelligence platforms fall short in empowering non-technical users due to overwhelming complexity and technical jargon. Learn practical strategies to transform your BI solution into a working BI platform that simplifies data access and enables every team member to make data-driven decisions confidently. Discover how role-based dashboards, intuitive navigation, and comprehensive training can bridge the gap.
Uploaded on | 2 Views

BI Platforms Fail to Empower Non-Technical Users — Here’s How to Change That
PowerPoint presentation about 'BI Platforms Fail to Empower Non-Technical Users — Here’s How to Change That'. This presentation describes the topic on Most Business Intelligence platforms fall short in empowering non-technical users due to overwhelming complexity and technical jargon. Learn practical strategies to transform your BI solution into a working BI platform that simplifies data access and enables every team member to make data-driven decisions confidently. Discover how role-based dashboards, intuitive navigation, and comprehensive training can bridge the gap.. Download this presentation absolutely free.
Presentation Transcript
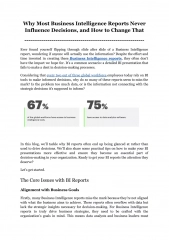
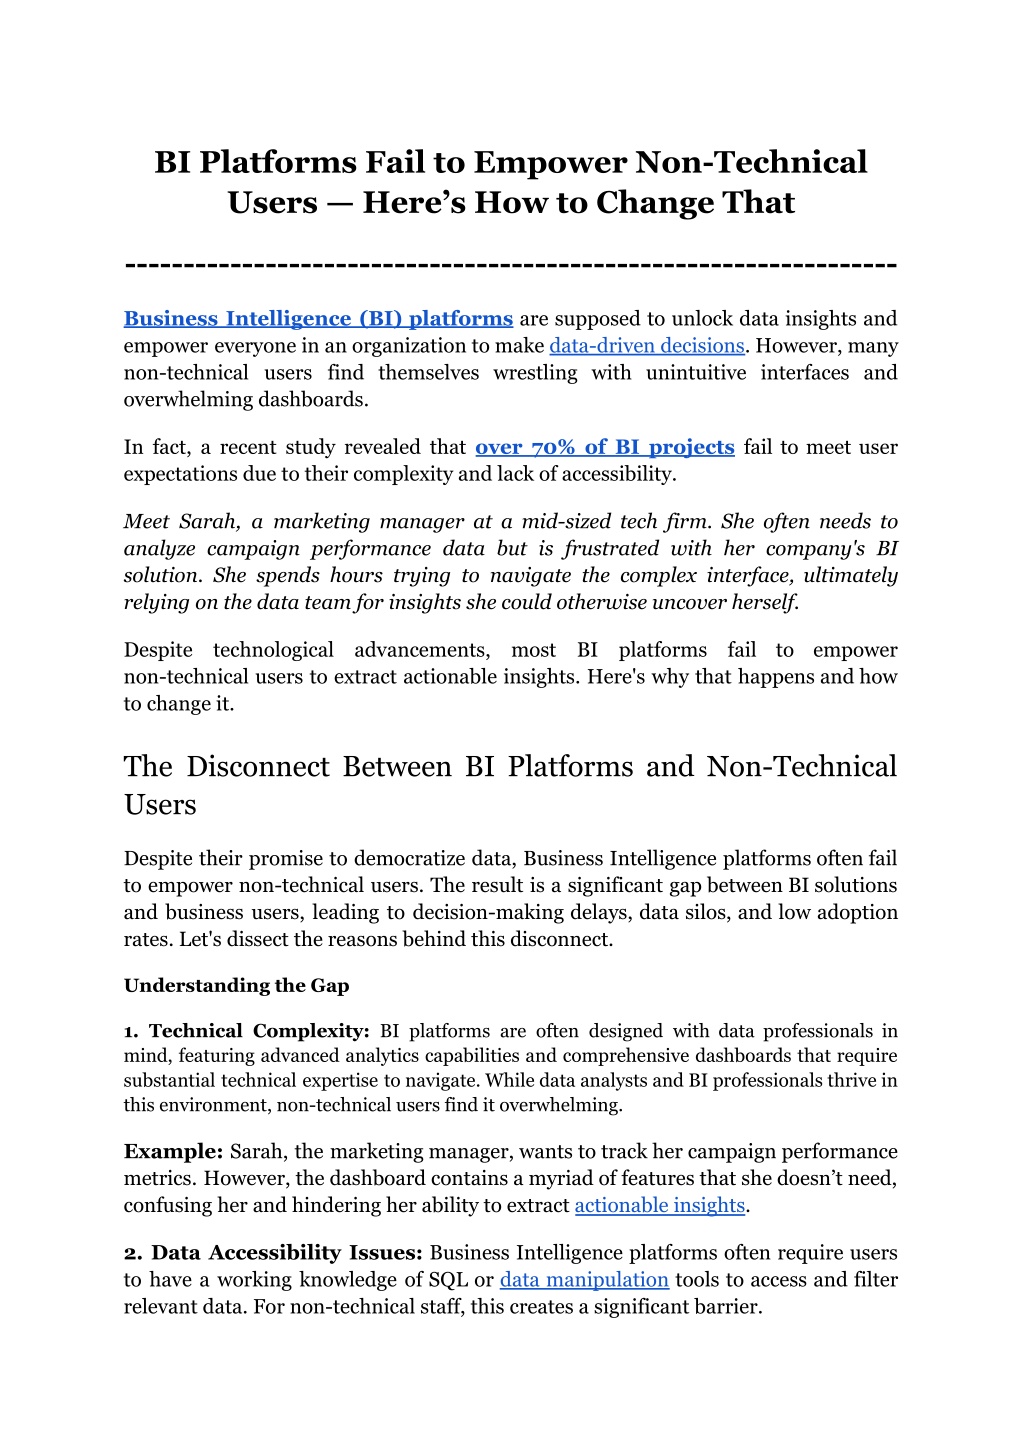
BI Platforms Fail to Empower Non-Technical Users Here s How to Change That ------------------------------------------------------------------ Business Intelligence (BI) platforms are supposed to unlock data insights and empower everyone in an organization to make data-driven decisions. However, many non-technical users find themselves wrestling with unintuitive interfaces and overwhelming dashboards. In fact, a recent study revealed that over 70% of BI projects fail to meet user expectations due to their complexity and lack of accessibility. Meet Sarah, a marketing manager at a mid-sized tech firm. She often needs to analyze campaign performance data but is frustrated with her company's BI solution. She spends hours trying to navigate the complex interface, ultimately relying on the data team for insights she could otherwise uncover herself. Despite non-technical users to extract actionable insights. Here's why that happens and how to change it. technological advancements, most BI platforms fail to empower The Disconnect Between BI Platforms and Non-Technical Users Despite their promise to democratize data, Business Intelligence platforms often fail to empower non-technical users. The result is a significant gap between BI solutions and business users, leading to decision-making delays, data silos, and low adoption rates. Let's dissect the reasons behind this disconnect. Understanding the Gap 1. Technical Complexity: BI platforms are often designed with data professionals in mind, featuring advanced analytics capabilities and comprehensive dashboards that require substantial technical expertise to navigate. While data analysts and BI professionals thrive in this environment, non-technical users find it overwhelming. Example: Sarah, the marketing manager, wants to track her campaign performance metrics. However, the dashboard contains a myriad of features that she doesn t need, confusing her and hindering her ability to extract actionable insights. 2. Data Accessibility Issues: Business Intelligence platforms often require users to have a working knowledge of SQL or data manipulation tools to access and filter relevant data. For non-technical staff, this creates a significant barrier.
Example: Tom, a sales executive, tries to analyze regional sales trends but finds the process of filtering data too technical. He needs assistance from the data team, leading to delays in decision-making. 3. Lack of Personalization: Generic dashboards and report templates provided by BI solutions often don't address specific business needs, making them less relevant for different departments. Example: Lisa, a financial manager, finds her BI platform filled with irrelevant metrics. She struggles to find customized insights that directly relate to her department s KPIs. Real-World Impacts 1. Decision-Making Delays: When non-technical business users can t independently access data, they rely on data analysts or IT departments to generate reports, causing significant delays. Example: Sarah waits several days for the data team to compile the campaign analysis she needs. By the time she receives the report, the insights are no longer timely. 2. Shadow IT Emergence: In the absence of user-friendly BI solutions, business users often revert to unsanctioned tools like Excel or Google Sheets for data analysis. Example: Tom creates his own Excel-based reports to analyze sales trends because it's easier than navigating the company s BI solution. This leads to inconsistent insights and data silos.
3. Wasted Investment: Companies spend millions on BI platforms that end up being underutilized or misused due to their complexity, resulting in wasted investments. Analyzing Non-Technical Users Why BI Platforms Fail to Empower Overwhelming Features: Many Business Intelligence platforms include a wide array of features meant for data analysts and scientists. While powerful, these features create cluttered dashboards that non-technical users find confusing. Solution: A working BI platform should prioritize role-based dashboards, providing only the most relevant features and metrics for specific departments. Unclear Terminology: Technical jargon like fact tables, data warehouses, and ETL processes can alienate non-technical users, making BI platforms feel intimidating. Solution: Glossaries, tooltips, and annotations can help bridge the understanding gap, translating technical terms into plain business language. Rigid Templates: Inflexible report templates and dashboards prevent departments from accessing insights tailored to their unique KPIs. Solution: Allow users to customize dashboards through drag-and-drop widgets and offer templates that align with different departmental needs. Training Gaps: Many businesses fail to provide adequate onboarding or ongoing training for non-technical users, leaving them frustrated and underprepared. Solution: Comprehensive training programs should be role-based and include on-demand video tutorials and interactive FAQs to reinforce learning. Practical Strategies to Make BI Platforms More Inclusive For Business Intelligence platforms to empower non-technical users, they must be intuitive, user-friendly, and accessible. Here s a comprehensive analysis of how to bridge the gap between complex BI solutions and everyday business users through practical strategies. User-Centric Design 1. Simplified Interface: Many Business Intelligence platforms overwhelm non-technical users with cluttered dashboards and complex analytics features.
A user-centric design focuses on providing streamlined dashboards with only essential features relevant to specific departments. Solution: Create role-based dashboards for marketing, sales, finance, and other departments, each with a simple layout showcasing key metrics. Example: Edit Suits Co., a high-end menswear company, implemented a working BI platform with role-based dashboards for each department. Patrick Jungo, the Co-Founder, leveraged his executive dashboard (nicknamed "the Force") to monitor KPIs across marketing, sales, operations, and customer service. This holistic view enabled the team to make data-driven decisions quickly. 2. Intuitive Navigation: Navigating BI solutions should be logical and straightforward for non-technical users. The platform should guide users from data selection to visualization without requiring technical knowledge. Solution: Implement step-by-step wizards for common data analysis tasks and drag-and-drop functionality to build custom reports. 3. Customizable Widgets: Rigid report templates often fail to cater to the diverse needs of different departments. Customizable widgets allow non-technical users to personalize their dashboards with relevant metrics. Solution: Provide a library of widgets that users can easily add to their dashboards to track specific KPIs. Business Language and Terminology 1. Glossaries and Annotations: Technical jargon like "fact tables" and "ETL processes" can alienate non-technical users. Providing clear explanations of such terms through glossaries and annotations can improve understanding. Solution: Include a glossary of technical terms and annotations explaining complex visuals in plain business language. Example: A leading BI solution provider integrated an interactive glossary within its platform, reducing the learning curve for non-technical users. 2. Natural Language Queries: Non-technical users should be able to ask questions in plain language and receive straightforward insights. Natural language queries bridge the gap between business language and technical data. Solution: Enable users to ask questions like, "What were our top-selling products last quarter?" and receive visual answers. Example: A retail company implemented natural language queries in its BI solution, empowering store managers to analyze sales trends without IT assistance. Data Democratization 1. Self-Service Analytics: Accessing data independently is crucial for non-technical users. Self-service analytics enable business users to analyze data without relying on IT or data teams.
Solution: Introduce drag-and-drop functionality and guided data exploration to simplify analysis. 2. Centralized Data Hub: A centralized data hub with pre-defined data sources and metrics makes it easier for non-technical users to discover and analyze relevant information. Solution: Establish a unified data repository with secure, intuitive access for business users. Example: An insurance company created a centralized data hub within its BI platform, giving underwriters quick access to claims data. Comprehensive Training Programs 1. Role-Based Training: Training programs should be tailored to different user personas to address their unique challenges and needs. Solution: Develop onboarding programs specific to marketers, finance managers, and other roles to provide relevant knowledge. Example: A healthcare company offered role-based training for its marketing and HR teams, leading to higher BI adoption rates. 2. On-Demand Tutorials: On-demand video tutorials and interactive FAQs provide non-technical users with scenario-based learning and quick answers to common questions. Solution: Create a library of short video tutorials addressing frequent BI challenges and include an interactive FAQ section. Example: A manufacturing firm introduced a series of on-demand tutorials, reducing the number of BI support tickets by 30%. Conclusion While Business Intelligence platforms promise to democratize data, they often fall short of empowering non-technical users. Complex dashboards, technical jargon, and lack of training leave many business users frustrated and reliant on IT teams. However, practical strategies like user-centric business-friendly language, and comprehensive training can transform a BI solution into a working BI platform that truly empowers all teams. design, intuitive navigation, Edit Suits Co.'s and over 20,000 others success story with Grow shows how a thoughtfully designed BI platform can provide a unified view of the business, enabling every team member to make data-driven decisions with confidence. By creating role-based dashboards, offering self-service analytics, and ensuring comprehensive training, Grow enables companies to foster a data-driven culture and respond to challenges in real-time. Ready to transform your BI platform into a working BI solution? Try Grow s No-code BI with a 14-day free trial and empower your non-technical users to make data-driven decisions effortlessly.
Start Your Free 14-Day Trial Curious about what others think of Grow? Check out Grow Reviews from Verified Users on Capterra to see how companies are leveraging it to boost their data strategy.