Understanding the Drop Reports in South African Water Regulation

The Drop Reports, comprising the Green Drop, Blue Drop, and No Drop assessments, provide valuable insights into the state of wastewater treatment and drinking water systems in South Africa. These reports focus on infrastructure condition, maintenance, operational processes, efficiency, and water conservation efforts. The regulatory framework introduced by the Department of Water and Sanitation plays a crucial role in ensuring compliance with water quality and distribution standards.

Understanding the Drop Reports in South African Water Regulation
PowerPoint presentation about 'Understanding the Drop Reports in South African Water Regulation'. This presentation describes the topic on The Drop Reports, comprising the Green Drop, Blue Drop, and No Drop assessments, provide valuable insights into the state of wastewater treatment and drinking water systems in South Africa. These reports focus on infrastructure condition, maintenance, operational processes, efficiency, and water conservation efforts. The regulatory framework introduced by the Department of Water and Sanitation plays a crucial role in ensuring compliance with water quality and distribution standards.. Download this presentation absolutely free.
Presentation Transcript
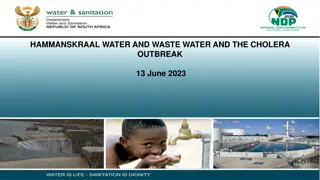
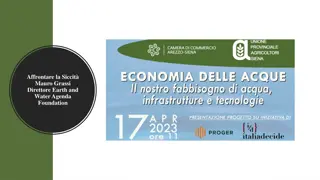
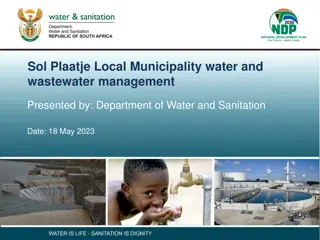
Regulatory Watch Reports Drinking Water (Blue Drop) Wastewater (Green Drop) Water Conservation and Demand Management (No Drop) 6 June 2023
Introduction to the Drop Reports In terms of the National Water Act and Water Services Act, DWS is the regulator of the water sector The Green, Blue and No Drop Certification programmes are tools to provide regulatory information regarding water services, which are largely the Constitutional responsibility of municipalities DWS introduced these incentive-based regulation programmes in 2008 In 2014 DWS stopped the programmes Minister Mchunu reintroduced the programmes after being appointed as Minister in late 2021 3
The domestic water cycle Water for domestic use goes through a cycle. 1. Raw water is drawn from rivers and dams and treated in Water Treatment Works by either water boards or municipalities before it is supplied to households. Treated water is required by law to meet drinking water standards set by the South African Bureau of Standards in South African National Standard (SANS) 241. Municipalities and water boards are also required to conduct regular tests on the treated water to ensure that it complies with the standard. 2. 3. After the water has been used by households, it goes through the sewer system to municipal Waste Water Treatment Works. The Waste Water Treatment Works remove waste from the water and then return the water to the rivers. The effluent from Waste Water Treatment Works which goes into rivers is also required to meet minimum standards, set by the Department of Water and Sanitation. 4
What each Drop Report focuses on Green Drop report is a comprehensive assessment of the state of all wastewater treatment systems in South Africa, including municipal, Department of Public Works and private wastewater treatment systems Blue Drop report is a similar assessment of the state of all drinking water systems (including water treatment works and municipal water distribution systems) in the country Both reports include assessments of the condition of the infrastructure; whether the capacity of the infrastructure is sufficient to deal with the demand; whether the required maintenance is being done on the infrastructure, whether the infrastructure is operated correctly; whether the proper treatment processes are followed; whether proper monitoring and controls are in place; and whether the staff have the necessary skills and qualifications No Drop report is an assessment of the degree to which the drinking water distribution systems of municipalities supply water efficiently, without wasting water No Drop assessment includes the levels of physical water losses in the system (for example through leaks in pipes); levels of non-revenue water; the amount of water used per customer per day; whether infrastructure is being maintained properly to minimise wastage; the existence of plans and strategies to reduce water losses; the effectiveness of metering, billing and revenue collection systems 5
Purpose of the Drop Reports The aim of this uniquely South African regulatory tool is to improve municipal drinking water quality, wastewater management as well as water conservation and demand management The reports keep the public and stakeholders informed and updated with credible data and information about the state of water and sanitation services in the country The reports also recognise water services institutions that achieve compliance and excellence in providing such services. This serves as an incentive for water services institutions to improve their performance The reports identify what needs to be done to address each of the identified shortcomings o In this regard, the reports are a support mechanism, in addition to being a regulatory mechanism, because they provide the owners of the infrastructure with advice and guidance as to how to improve their water and sanitation services 6
Release of the Green, Blue and No Drop Watch Reports Each comprehensive drop report is released every two years, with interim report in alternate year Full Green Drop was released in 2022, along with interim Blue Drop report Interim Green Drop and full Blue Drop reports will be released in July 2023 respectively Full No Drop report will be released in September Department is now releasing Green, Blue and No-drop Watch reports, as a precursor to the releases of the reports in July The three watch reports are now available on the DWS website o 7
The Green, Blue and No Drop Watch Reports Blue Drop Watch Report: o 2023 Blue Drop Watch Report provides an assessment of the condition of water distribution infrastructure and drinking water quality of a sample of the drinking water supply systems in the country o Full Blue Drop report will cover all drinking water supply systems in the country and will also include non- technical aspects such as skills and qualifications of municipal staff No Drop Watch Report: o 2023 No Drop Watch Report is based on water conservation and demand management reports received from a sample of municipalities o Information was used to extrapolate projections regarding the extent of water losses and non-revenue water in the country o Full No Drop report will provide audited assessment of water losses and non-revenue water in all municipalities in the country Green Drop Watch Report: o Provides information on what has been done to address wastewater systems of Water Services Authorities that scored less than 30% in the 2022 Green Drop Report 8
1. GREEN DROP WATCH REPORT: SUMMARY OF FINDINGS 2022 full Green Drop report released in April 2022 found 334 out of 850 (39%) municipal wastewater systems in 90 municipalities which are water services authorities (63% of the 144 water services authorities) to be in critical condition, receiving Green Drop scores of 30% and below In 2013, when the last Green Drop assessment report was done, 248 out of 824 (30%) municipal wastewater systems were in a critical condition, indicating a decline between 2103 and 2022 Following the release of the 2022 Green Drop report, the Department issued non-compliance notices to these 90 municipalities, requesting the municipalities to submit corrective action plans to address the shortcomings identified in the Green Drop report By March 2023, Department had received corrective action plans from municipalities for 168 of the 334 wastewater systems (i.e. a 50% response rate). 43 of the 90 municipalities requested support from the Department to develop corrective action plans By March 2023, only 34 of the 168 plans submitted to the department were being implemented, with the balance being in planning phase or no progress reported For those municipalities which did not submit corrective action plans, DWS has issued directives in terms of the National Water Act compelling them to submit such plans Criminal charges have been laid against some of the municipalities which have not submitted corrective action plans 10
Municipal progress in addressing findings of 2022 Green Drop report (wastewater treatment systems in a critical condition) Province No of Water Services Authorities with systems in a critical condition No of wastewater treatment systems in a critical condition No (%) of corrective action plans received by DWS No of corrective action plans in implementation (31 March 2023) Eastern Cape Free State Gauteng KwaZulu Natal Limpopo Mpumalanga Northern Cape North West Western Cape National Totals 10 17 4 4 10 8 23 7 7 90 48 64 9 20 50 33 59 33 18 334 45 (94%) 10 (16%) 8 (89%) 0 (0%) 50 (100%) 10 (30%) 14 (24%) 13 (39%) 18 (100%) 168 (50%) 2 None 2 None None None 8 9 13 34 (10%) Details of which municipalities were found to have wastewater systems in a critical condition are in the Watch report on the DWS website. Details of which municipalities submitted corrective action plans are also in the Watch report. 11
2. BLUE DROP WATCH REPORT SUMMARY OF FINDINGS 151 out of 1035 water treatment systems in the country were sampled. All water service authorities were covered by the sample. Infrastructure condition: 3% of the sampled systems were found to be in a critical infrastructural condition, 12% of the sampled systems were found to be in an poor infrastructural condition, 49% of the sampled systems were found to be in an average infrastructural condition, 31% in good condition, and 5% in an excellent condition These findings were supported in the 2022 South African Institute of Civil Engineers Infrastructure Report Card Water quality testing requirements in South Africa In terms of SANS 241, municipalities are required to monitor the microbiological and chemical quality of the water provided to residents at specified intervals, including hourly, daily, weekly, fortnightly and monthly tests of various types 12
Microbiological and chemical water quality compliance: Water quality tests carried out by the municipalities themselves during the 2021/2022 municipal financial year were assessed 39% of systems achieved excellent, 11% of systems achieved good, 9% achieved poor, and 41% achieved bad microbiological water quality compliance 17% of systems achieved excellent, 13% of systems achieved good, 15% achieved poor, and 55% achieved bad chemical water quality compliance Status Definition Bad < 95% of water quality tests meet SANS 241 standards Poor 95-97% of water quality tests meet SANS 241 standards Good 97-99% of water quality tests meet SANS 241 standards Excellent > 99% of water quality tests meet SANS 241 standards Microbiological compliance measures how well the treatment process is removing harmful bacteria and other micro-organisms from the water Chemical compliance measures the chemical suitability of the water for human consumption, as well as for protection of infrastructure and household equipment SANS 241 is informed by World Health Organisation Guidelines, in terms of which at least 97% (i.e. good or excellent compliance) of tests for microbiological contaminants and chemical compliance conducted over a year should comply with water quality standards, for the water to be considered safe to drink The number of samples to be tested in a specific water supply system is informed by the Water Safety Planning Requirements of the SANS 241 13
Non-provision of information on testing to DWS During the audit period 11 municipalities did not report water quality data to the Department or provide any other evidence that they have been testing their water quality The Department has issued non-compliance notices to those municipalities instructing them to issue advisory notices to their residents that their water might not be safe to drink if it has not been properly tested 14
Blue Drop Watch report: drinking water infrastructure condition status Excellent: Ideal performance and fully functional infrastructure and processes >95- 100% Good: Fully functional infrastructure and processes, with minor corrections to be made >80- <95% Average: Partially functional infrastructure and processes, and average performance >50- <80% Poor: Partial functionality and unsatisfactory performance, with major corrections to be made >31- <50% Critical: Partial functionality and unsatisfactory performance, with major corrections to be made 0- <30% Details of which municipalities were found to have wastewater systems in a poor and critical condition are in the Watch report on the DWS website. 15
Drinking Water Quality : Microbiological Compliance Microbiological Compliance 59 39% 62 41% 13 9% 17 11% # Excellent Status # Good Status # Poor Status # Bad Status 16
Drinking Water Quality: Chemical Compliance Chemical Compliance 25 17% 20 13% 83 55% 23 15% # Excellent Status # Good Status # Poor Status # Bad Status 17
BLUE DROP WATCH REPORT: DRINKING WATER QUALITY Total # water supply systems assessed 15 21 8 15 11 17 Microbiological Compliance Chemical Compliance # # Province # Good Status # Poor Status # Bad Status # Good Status # Poor Status # Bad Status Excellent Status Excellent Status Eastern Cape Free State Gauteng KwaZulu Natal Limpopo Mpumalanga Northern Cape North West Western Cape National totals 6 7 5 9 5 2 2 5 0 2 1 1 1 1 0 1 1 1 6 2 2 5 3 0 2 0 6 0 3 1 2 2 2 1 1 3 1 11 8 (4*) 3 3 4( 1*) 13 (3*) 11 (4*) 2 8 7 (1*) 12 (3*) 27 7 0 4 16 (3*) 3 2 3 19 (3*) 10 27 4 14 1 5 1 3 4 5 0 8 3 3 3 7 4 9 151 59 17 13 62 25 20 23 83 *number of WTWs which did not provide information to DWS 18
IMPLICATIONS OF THE BLUE DROP WATCH REPORT FINDINGS In the 2012 Blue Drop report, only 10% of municipalities had bad or poor microbiological water quality (as opposed to 50% in this sample) This indicates that there has been a deterioration in drinking water quality since the last blue drop report was done The 2023 blue drop watch report indicates that the drinking water produced from some municipal water treatment systems during the 2021/2022 municipal financial year did not meet the SANS 241 standard and could on occasion have posed a potential health risk The report does not provide an indication of the current status of water quality in municipalities In terms of SANS241 and the norms and standards issued by DWS under the Water Services Act, when the tests carried out by a municipality indicate that the water supplied poses a health risk, the municipality must inform its consumers that the quality of the water that it supplies poses a health risk DWS has sent directives to the municipalities identified in the Watch Report as having systems with poor or bad compliance. The directives require the municipalities to inform their residents should they still have poor or bad compliance The public can safely consume water from their taps if their municipalities indicate that the water being provided is being tested and meets the requirements of SANS 241. WSAs are responsible by law to inform affected constituencies as soon as there is any change in quality 19
3. NO DROP WATCH REPORT SUMMARY OF FINDINGS Introduction The No Drop Watch Report assesses the status of water losses and non-revenue water (NRW) in South Africa against regulatory compliance requirements and best management practices The report is based on analysis of the water balance data submitted by municipalities for their financial year ending June 2022 The report is based on a sample of 42 datasets which were received from WSAs in 2022 (29% of 144 WSAs submitted data sets) The national water balance presented in the Watch Report is extrapolated from the sample of datasets received from municipalities to provide an estimate of the water balance and non-revenue water for all 144 municipalities 20
Findings The System Input Volume (meaning the total volume of water treated for municipal use) is estimated to be approximately 4.3 million m3/annum Of this, 2 million m3/annum (46%) is estimated to be non-revenue water (NRW). This is the volume of water that municipalities are unable to collect revenue for In 2015 when the last No Drop report was published, the national NRW figure was estimated to be 35% Non-revenue water is made up of water losses and the unbilled component of authorised consumption The international average for non-revenue water is below 30% The national trends suggest that per capita consumption is approximately 216 litres/capita/day compared to the international average of 173 l/c/d This is an anomaly given that South Africa is a water scarce county The high levels of physical losses in municipal distribution systems is one of the main reasons for the relatively high level of per capita water consumption in South Africa This indicates poor operation and maintenance of infrastructure leading to unacceptably high physical losses Some municipalities have been able to reduce their non-revenue water. In order to reduce non-revenue water, municipalities need to improve operation and maintenance of their infrastructure; repair leaks; improve metering, billing, revenue collection, and debtor management; improve pressure management; and engage in community education and awareness; amongst other measures. The final water balance will be obtained and confirmed through the full No Drop report that will be published in September 2023 21
Provincial benchmark for non-revenue water (m3/annum) Region System Input Volume Revenue water Non-revenue water (NRW) % NRW l/c/d EC 341 784 801 180 856 704 160 928 096 47.1% 203 FS 245 273 746 114 972 777 130 300 969 52.9% 224 GT 1 520 493 167 883 182 277 637 310 891 41.9% 253 KZN 816 349 522 379 242 693 437 106 828 53.5% 224 LP 297 623 119 128 801 298 168 821 821 56.7% 210 MP 287 781 407 140 491 650 147 289 757 51.2% 186 NC 108 607 828 47 554 453 61 053 374 56.2% 250 NW 232 123 394 114 267 940 117 855 454 50.8% 176 WC 430 141 867 302 936 992 127 204 875 29.6% 161 National 4 280 178 850 2 292 306 784 1 987 872 066 46.4% 216
Municipal categories - benchmark summary Category System Input Volume Revenue water Non-revenue Water (NRW) % NRW l/c/d A (metropolitan municipalities) 2 255 411 972 1 318 024 060 937 387 912 41.6% 244 B1 (secondary cities) 742 194 333 366 223 214 375 971 119 50.7% 236 B2 (large towns) 183 919 744 113 756 273 70 163 470 38.1% 200 B3 (small towns) 286 374 783 140 402 768 145 972 014 51.0% 173 B4 (mostly rural) 112 492 833 52 810 993 59 681 841 53.1% 151 C (district municipalities) 699 785 185 301 089 476 398 695 710 57.0% 186 National 4 280 178 850 2 292 306 784 1 987 872 066 46.4% 216
DWS actions to address the findings Regulatory actions In role of Regulator, Department issues non-compliance notices and directives in terms of the National Water Act to the relevant municipalities instructing them to correct the situation Where the notices and directives are not acted upon, the Department institutes legal action against the municipality The Department is in the process of strengthening its role as the regulator of water services. This includes developing more comprehensive and more stringent norms and standards for water services and standardising its regulatory processes so that it is more consistent with its regulatory actions Support actions National government is providing more than R60 billion per annum in grants and transfers to municipalities for water and sanitation services Minster has crisscrossed the country visiting those municipalities with severe challenges with water and sanitation services. In many of the worst performing municipalities, Minister and municipal leadership have agreed on improvement plans DWS contribution is in form of grants (R12 billion per annum from Regional Bulk Infrastructure Grant and Water Services Infrastructure Grant), and technical advice and management support from DWS and water boards 24
Legislative reform There are limits to which support and intervention by the national government can address the decline in the reliability and quality of water and sanitation services The cause of the decline is poor maintenance and operation by municipalities which must be funded by revenue from the sale of water by municipalities to customers DWS is repeatedly providing municipalities with grants to repair infrastructure, which is not maintained by the municipalities, deteriorates again rapidly, and then funding needs to be provided again The high levels of support and intervention by the national government are slowing the decline in water and sanitation services, not arresting or reversing it Legislative reforms may also be required to ensure that water service providers are professionally managed, capable, efficient and financially viable institutions that deliver water services to the required standards Water Services Act differentiates between Water Services Authorities and Water Services Providers Role of WSA is to ensure that water services are provided to required standard Role of WSP is to provide the services DWS is consulting with water sector stakeholders regarding reforms to Water Services Act to strengthen role of municipalities as Water Services Authorities to ensure that competent Water Services Providers are in place and to enable Minister to intervene more effectively as the Regulator 25
Drinking Water Quality sampled systems in Eastern Cape (see slide 13 for definitions of colour coding) Water Supply System (WSS) assessed Water Treatment Works (WTW) assessed Microbiological compliance Chemical compliance # Municipality (WSA) 1 2 3 4 5 6 7 8 9 10 Koukamma LM 11 Makana LM 12 Ndlambe LM 13 Nelson Mandela Bay MM 14 OR Tambo DM 15 Sundays River LM Alfred Nzo DM Amathole DM Blue Crane LM Buffalo City MM Buffalo City MM Chris Hani DM Dr Beyers Naude LM Joe Gqabi DM Kouga LM Mount Ayliff Morgans Bay Somerset East Mdantsane Umzonyana Intsika Yethu Graaf Reinet Barkley East Jeffreys Bay Kareedouw Grahamstown Cannon Rocks Nelson Mandela Bay Thornhill Addo Mount Ayliff Morgans Bay Orange Fish Nahoon Umzonyana Tsomo Graaf Reinet Barkley East Jeffreys Bay Kareedouw James Kleynhans Cannon Rocks/Boknes Linton Thornhill Addo Nomathamsanqa >99.90% 86.67% 80.95% 82.14% 98.85% 99.90% 97.96% 95.20% >99.90% >99.90% 82.55% >99.90% >99.90% 91.19% 60.42% 94.08% 91.57% 82.14% 95.44% 90.18% 91.07% 87.14% 96.25% 99.90% 80.00% 80.96% >99.90% 87.20% 89.71% 68.06% 26
Drinking Water Quality sampled systems Free State Water Supply System (WSS) assessed Deneysville Parys Fouriesburg Ficksburg Harrismith Vijoenskroon Bethulie Bloemfontein, Dewetsdorp, Wepener Welbedacht Virginia Balkfontein Reitz Clarens Jacobsdal Ladybrand Winburg Zastron Bloemfontein Hoopstad Frankfort Vrede Hertzogville Water Treatment Works (WTW) assessed Deneysville Parys Fouriesburg Ficksburg Wilge-Harrismith Vijoenskroon Bethulie Microbiological compliance 98.78% NI >99.90% >99.90% NI 62.18% >99.90% >99,90% 98.77% 98.17% 96.47% >99.90% 57.50% 97.22% 57.14% 67.09% 98.26% >99.90% NI >99.90% NI Chemical compliance 87.85% NI 97.29% 85.06% NI 85.95% >99.90% 97.39% 98.45% 98.25% 93.31% 95.28% 92.25% 76.80% 80.00% 97.65% 95.32% 99.30% NI 97.81% NI # Municipality (WSA) 1 Metsimaholo LM 2 Ngwathe LM 3 Dihlabeng LM 4 Setsoto LM 5 Maluti-a-Phofung LM 6 Moqhaka LM 7 Kopanong LM 8 Mangaung MM 9 Matjhabeng LM 10 Nala LM 11 Nketoana LM 12 Dihlabeng LM 13 Letsemeng LM 14 Mantsopa LM 15 Masilonyana LM 16 Mohokare LM 17 Mangaung MM 18 Tswelopele LM 19 Mafube LM 20 Phumelela LM 21 Tokologo LM Virginia Balkfontein Reitz Clarens Jacobsdal Genoa Winburg Zastron Maselspoort Hoopstad Frankfort Vrede Hertzogville NI No Information 27
Drinking Water Quality sampled systems Gauteng Water Supply System (WSS) assessed Ekurhuleni Lesedi Main Greater Johannesburg Pretoria Temba Emfuleni WSS Vaaloewer Cullinan Vaal Marina Water Treatment Works (WTW) assessed Impala Park Reservoirs Heidelberg Command Reservoirs Illovo Command Reservoirs Temba Vereeniging Vaaloewer Cullinan Vaal Marina Microbiological compliance 99.66% >99.90% 99.43% 85.15% 99.90% 0.00% >99.90% 90.43% Chemical compliance 99.46% 99.51% 99.54% 80.20% 99.91% 0.00% 99.30% 95.88% # Municipality (WSA) 1 2 3 4 5 6 7 8 City of Ekurhuleni MM Lesedi LM City of Johannesburg MM City of Tshwane MM Emfuleni LM Emfuleni LM City of Tshwane MM Midvaal LM Note that only one water supply system was tested in the City of Tshwane the Temba WTW, which supplies Hammanskraal, for which Tshwane has issued a do not drink notice The other water supply systems in the City of Tshwane were not tested the Watch Report only sampled one system per WSA The Full Blue Drop report to be issued in July will cover all the water supply systems of Tshwane and other municipalities in Gauteng 28
Drinking Water Quality sampled systems KZN Water Supply System (WSS) assessed Kokstad Impendle Spring Mtubatuba Ladysmith Ulundi Nkonjeni Durnacol Mzingazi Greater Mthonjaneni Nsezi Newcastle Nqutu Umsunduzi Bhobhoyi Sundumbili eThekwini Main (Umgeni, Kloof, Mdhloti) Water Treatment Works (WTW) assessed Kokstad Impendle Spring Protection Mtubatuba Ladysmith Ulundi Durnacol Umzingazi Greater Mthonjaneni Nsezi Ngagane Vants Drift Midmar Bhobhoyi Sundumbili Microbiological compliance >99.90% 97.96% >99.90% >99.90% 96.86% 97.59% 92.82% 90.74% >99.90% >99.90% 99.07% >99.90% >99.90% 88.05% Chemical compliance 98.88% 94.24% 94.12% 69.77% 85.31% 96.80% 97.33% 92.78% 99.88% 98.91% 94.24% 99.93% 86.89% 91.67% # Municipality (WSA) Harry Gwala DM Umgungundlovu DM uMkhanyakude DM uThukela DM Zululand DM Amajuba DM Mhlathuze LM King Cetshwayo DM Mhlathuze LM 10 Newcastle LM 11 Umzinyathi DM 12 Msunduzi LM 13 Ugu DM 14 iLembe DM 1 2 3 4 5 6 7 8 9 The 15 eThekwini MM Kloof >99.90% 99.77% 29
Drinking Water Quality sampled systems Limpopo Water Supply System (WSS) assessed Mogwadi Mankweng Zeeland Mokopane Mahwelereng Giyani Molepo Groblersdal Bela Bela/Magalies Water LIM365: Modimolle/Magalies Water The Greater Thabazimbi- Magalies Nzhelele Water Treatment Works (WTW) assessed Mogwadi Ebenhezer Zeeland Dooringdraai Giyani Molepo Groblersdal Bela Bela Microbiological compliance 85.71% 99.29% 77.27% 94.57% >99.90% >99.90% >99.90% 97.37% Chemical compliance 74.07% 96.94% 95.12% 89.63% 90.38% 97.04% 95.65% 94.86% # Municipality (WSA) 1 Capricorn DM 2 Polokwane LM 3 Lephalale LM 4 Mogalakwena LM 5 Mopani DM 6 Polokwane LM 7 Sekhukhune DM 8 Bela Bela LM 9 Modimolle-Mookgophong LM Donkerpoort >99.90% 81.82% Thabazimbi Chlorination Plant Khalavha 10 Thabazimbi LM NI NI 11 Vhembe DM 96.43% 91.12% NI No Information 30
Drinking Water Quality sampled systems Mpumalanga Water Supply System (WSS) assessed Nelspruit White River Country Estate Greater Dipaleseng LM Victor Khanye Carolina Volksrust Belfast Witbank Douglas dam Driekoppies/ Shoemansdal/ Buffelspruit/ Shongwe Standerton Mkhondo Inyaka Lydenburg Weltevreden Bomandu previously known as Machipe (Goederede) Middelburg/Mhluzi Water Treatment Works (WTW) assessed Nelspruit New White River Country Estate Fortuna Delmas Carolina Volksrust Belfast Witbank Ermelo North Microbiological compliance >99.90% NI NI 97.55% 39.66% 70.37% 92.65% 93.28% 66.15% Chemical compliance 99.30% NI NI 98.12% 76.54% 93.50% 80.15% 95.70% 87.12% # Municipality (WSA) 1 2 3 4 5 6 7 8 9 City of Mbombela City of Mbombela Dipaleseng LM Victor Khanye LM Chief Albert Luthuli LM Dr Pixley Ka Isaka Seme LM Emakhazeni LM Emalahleni LM Msukaligwa LM 10 Nkomazi LM Driekoppies 91.67% 86.23% 11 Lekwa LM 12 Mkhondo LM 13 Bushbuckridge LM 14 Thaba Chweu LM 15 Dr JS Moroka LM Standerton New Mkhondo Piet Retief Inyaka Lydenburg Weltevreden 54.03% 94.19% >99.90% NI 82.09% 71.50% 94.21% 98.17% NI 80.96% 16 Thembisile Hani LM Bundu 31.25% 99.58% 17 Steve Tshwete LM Vaalbank 96.22% 87.74% NI No Information 31
Drinking Water Quality sampled systems North-West Water Supply System (WSS) assessed Hartbeespoort Rustenburg North City of Matlosana Koster Water Treatment Works (WTW) assessed Schoemansville Bospoort Midvaal Koster Leeudoringstad Reservoir and Pumpstation Mothibestad Booster Pumpstation and command reservoir Potchefstroom Madikwe Mmabatho Bogosing Microbiological compliance >99.90% 95.29% 99.03% 90.48% Chemical compliance 95.19% 95.96% 98.74% 93.31% # Municipality (WSA) 1 2 3 4 Madibeng LM Rustenburg LM City of Matlosana LM Kgetlengrivier LM 5 Maquassi Hills LM Leeudoringstad-Witpoort 97.81% 98.48% 6 Moretele LM Temba 86.20% 84.15% JB Marks LM Moses Kotane LM Ngaka Modiri Molema DM 10 Dr Ruth S Mompati DM 7 8 9 Potchefstroom Madikwe Mafikeng Bogosing 99.22% >99.90% 48.89% 93.75% 98.30% 86.59% 95.70% 82.18% 32
Drinking Water Quality sampled systems Northern Cape Water Supply System (WSS) assessed Groblershoop Barkley West Kuruman-Wrenchville Mothibistad-Mapoteng Hotazel Onseepkans (Melkbosrand) Ritchie Hartswater Calvinia Garies Port Nolloth-Alexander bay-Aftmyl Sutherland Vioolsdrift NC083: AH September (Upington) Kakamas Bulk Water Water Treatment Works (WTW) assessed Groblershoop Barkley West Kuruman (Old Reservoir System) Mothibistad Hotazel Onseepkans/ Melkbosrand WTW Ritchie Hartswater Calvinia Garies Aftmyl borehole system Sutherland Desalination Plant Vioolsdrift AH September Kakamas Microbiological compliance >99.90% 87.80% 90.84% 91.30% >99.90% NI 96.39% 70.00% 96.47% 0.00% >99.90% 92.86% 83.33% 96.40% >99.90% Chemical compliance 92.92% 74.56% 97.78% 90.94% 99.03% NI 85.38% 74.85% 95.90% 0.00% 81.25% 85.00% 80.25% 86.96% 67.86% # Municipality (WSA) 1 iKheis LM 2 Dikgatlong LM 3 Ga-Segonyana LM 4 Ga-Segonyana LM 5 Joe Morolong LM 6 Khai Ma LM 7 Sol Plaatje LM 8 Phokwane LM 9 Hantam LM 10 Kamiesberg LM 11 Richtersveld LM 12 Karoo Hoogland LM 13 Nama Khoi LM 14 David Kruiper LM 15 ! Kai! Garib LM NI No Information Northern Cape sampled systems continues on next page 33
Drinking Water Quality sampled systems Northern Cape (2) Water Supply System (WSS) assessed Vanderkloof Prieska Colesberg De Aar Carnarvon Victoria West Danielskuil Kathu Warrenton Douglas Hopetown Postmasburg Microbiological compliance NI 80.77% 94.20% NI 96.00% 78.57% 90.54% >99.90% 86.36% 75.00% >99.90% >99.90% Chemical compliance NI 90.56% 95.71% NI 88.14% 83.05% 99.24% >99.90% 70.13% 85.29% 96.97% 97.55% # Municipality (WSA) Water Treatment Works (WTW) assessed 16 Renosterberg LM 17 Siyathemba LM 18 Umsobomvu LM 19 Emthanjeni LM 20 Kareeberg LM 21 Ubuntu LM 22 Kgatelopele LM 23 Gamagara LM 24 Magareng LM 25 Siyancuma LM 26 Thembelihle LM 27 Tsantsabane LM Vanderkloof Flippie Holtzhausen Colesberg De Aar Borehole Carnarvon Borehole Victoria West Borehole/ Chlorine Dispenser Danielskuil Borehole/ Reservoir Kathu Warrenton Douglas Hopetown Vaal Gamagara NI No Information 34
Drinking Water Quality sampled systems Western Cape Water Treatment Works (WTW) assessed Beaufort West Ladismith Knysna Laingsburg Main Reservoir Kleinbrak Dysselsdorp Prince Albert Plettenberg Bay George New Citrusdal Riversdale Ashton Ceres Withoogte Bredasdorp Water Supply System (WSS) assessed Microbiological compliance Chemical compliance # Municipality (WSA) 1 2 3 Beaufort West LM Kannaland LM Knysna LM Beaufort West Ladismith Knysna and Desal >99.90% 92.31% 98.44% 99.23% >99.90% 91.97% 4 Laingsburg LM Laingsburg Main Reservoir 95.65% 97.78% 5 6 7 8 9 10 Cederberg LM 11 Hessequa LM 12 Langeberg LM 13 Witzenberg LM 14 Saldanha Bay LM 15 Cape Agulhas LM Mosselbay LM Oudtshoorn LM Prince Albert LM Bitou LM George LM Mosselbaai/ Grootbrak/ Kleinbrak Dysselsdorp Prince Albert Plettenberg Bay George Citrusdal Riversdale Riversdale/ Ashton Citrusdal/ Ceres Saldanha Bay Bredasdorp 99.72% 96.04% 94.32% >99.90% >99.90% >99.90% >99.90% 92.19% >99.90% 97.86% >99.90% 95.09% 88.25% 87.52% >99.90% 99.22% 99.73% 88.12% 95.85% 95.26% 96.55% 94.97% Western Cape sampled systems continues on next page 35
Drinking Water Quality sampled systems Western Cape (2) Water Treatment Works (WTW) assessed De Koppen Swellendam Vredendal Paradyskloof Piketberg Faure Steenbras Water Supply System (WSS) assessed Microbiological compliance Chemical compliance # Municipality (WSA) 16 Breede Valley LM 17 Swellendam LM 18 Matzikama LM 19 Stellenbosch LM 20 Bergrivier LM 21 City of Cape Town MM 22 City of Cape Town MM De Koppen (Fairyglen) Swellendam Vredendal Stellenbosch CBD Piketberg Cape Town Cape Town Drakenstein (Paarl Mountain & Cape Town) Caledon Greater Hermanus Grabouw Swartland 94.68% 96.00% >99.90% 99.22% 90.29% 99.69% 99.69% 97.47% 86.29% 95.67% 96.08% 93.52% 99.33% 99.33% 23 Drakenstein LM Welvanpas 98.73% 96.65% 24 Theewaterskloof LM 25 Overstrand LM 26 Theewaterskloof LM 27 Swartland LM Ruensveld West Preekstoel Grabouw Swartland >99.90% 98.53% >99.90% 98.25% 91.65% 99.68% 88.05% 97.39% 36


")


")

")