Science Week at a Glance: Water in Earth's Processes
This week in science class, students will be focusing on the role of water in Earth's processes, specifically waves, currents, and tides. The curriculum includes analyzing and interpreting data, creating graphic representations, and exploring the causes and effects of these natural phenomena. Students will also work on assignments related to the water cycle, ocean floor, rock cycle, and Earth's layers through various activities and PowerPoint presentations. The week is structured with daily standards, learning targets, warm-up sessions, and reminders for upcoming assessments.

Science Week at a Glance: Water in Earth's Processes
PowerPoint presentation about 'Science Week at a Glance: Water in Earth's Processes'. This presentation describes the topic on This week in science class, students will be focusing on the role of water in Earth's processes, specifically waves, currents, and tides. The curriculum includes analyzing and interpreting data, creating graphic representations, and exploring the causes and effects of these natural phenomena. Students will also work on assignments related to the water cycle, ocean floor, rock cycle, and Earth's layers through various activities and PowerPoint presentations. The week is structured with daily standards, learning targets, warm-up sessions, and reminders for upcoming assessments.. Download this presentation absolutely free.
Presentation Transcript
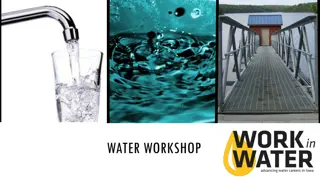
Week at A Glance for Science December 5-9 Water in Earth s Processes
November 28 Dec. 2 d. Analyze and interpret data to create graphic representations of the causes and effects of waves, currents, and tides in Earth s systems.
Waves Tides Currents
Homework for Science Monday: 2 square (water cycle, ocean floor, waves, tides) Draw Rock Cycle Create Rock Cycle Slide (Powerpoint) due 12/9 Tuesday: 2 square (water cycle, ocean floor, waves, tides) Draw Rock Cycle Wednesday: 2 square (Rock Cycle, Earth s layers) Water on Earth Powerpoint Thursday: Create Rock Cycle Slide (Powerpoint) See Slide 18 for idea (Water Cycle)
Monday, December 5 Standard: d. Analyze and interpret data to create graphic representations of the causes and effects of waves, currents, and tides in Earth s systems. Learning Target: I can explain the causes and effect of waves and tides. Warm-up: Review for CMA Work Session: Water on Earth Powerpoint Closing: TOD Reminders: CMA's this week.
Tuesday, December 6 Standard: d. Analyze and interpret data to create graphic representations of the causes and effects of waves, currents, and tides in Earth s systems. Learning Target: I can explain the causes and effect of waves, tides, and currents. Warm-up: Review for CMA Work Session: Water on Earth Powerpoint Closing: TOD Reminders: CMA's this week.
Wednesday, December 7 Standard: d. Analyze and interpret data to create graphic representations of the causes and effects of waves, currents, and tides in Earth s systems. Learning Target: I can explain the causes and effect of waves, tides, and currents. Warm-up: Review for CMA Work Session: Water on Earth Powerpoint Closing: TOD Reminders: CMA's this week.
Thursday, December 8 Standard: d. Analyze and interpret data to create graphic representations of the causes and effects of waves, currents, and tides in Earth s systems. Learning Target: I can explain the causes and effect of waves, tides, and currents. Warm-up: Review for CMA Work Session: Water on Earth Powerpoint Closing: TOD Reminders: CMA's this week.
Friday, December 9 Standard: d. Analyze and interpret data to create graphic representations of the causes and effects of waves, currents, and tides in Earth s systems. Learning Target: I can explain the causes and effect of waves, tides, currents. Warm-up: Review for CMA Work Session: Water on Earth Powerpoint Closing: TOD Reminders: CMA's this week.
Video Link: Ocean Currents Ocean currents can be caused by wind, density differences in water masses caused by temperature and salinity variations, gravity, and events such as earthquakes or storms. Currents are cohesive streams of seawater that circulate through the ocean.
Ocean currents are the continuous, predictable, directional movement of seawater driven by gravity, wind (Coriolis Effect), and water density. Ocean water moves in two directions: horizontally and vertically. Horizontal movements are referred to as currents, while vertical changes are called upwellings or downwellings.
High and low tides are caused by the moon. The moon's gravitational pull generates something called the tidal force. The tidal force causes Earth and its water to bulge out on the side closest to the moon and the side farthest from the moon. These bulges of water are high tides
Video Link: What Causes Tides? https://scijinks.gov/tides/
the arrangement of the natural and artificial physical features of an area.
Ocean Floor Video Click link
Click for Link to Website https://www.thinglink.com/scene/986989732015636481
5 2 6 1. Water 2. Sun 3. Heat 4. Evaporation 5. Condensation 6. Precipitation 7. Transpiration 8. Run off 3 7 4 8 1
5 2 6 3 7 4 8 1
Video Link: Water Cycle
96.5 % Oceans, seas, bays 1.74% Ice caps, Glaciers 1.69% Ground water .022% Permafrost .013 % Lakes .002% Rivers .001% Soil .001% Atmosphere/ water vapor .0008% Swamps .0001% Biological / living organisms
Video Link
Video Link
Tuesday, November 29 Standard: d. Analyze and interpret data to create graphic representations of the causes and effects of waves, currents, and tides in Earth s systems. Learning Target: I can explain the causes and effect of waves and tides. Warm-up: Chapter 15 Workbook Packet Work Session: Ocean Waves vocabulary , Ch.15 Lesson 2 (waves and tides); Review WAG Nov28; Lesson 2 Review p.546; Water on Earth Powerpoint Closing: Think Pair Share Reminders: Quiz Ocean waves, tides, currents
Wednesday, November 30 Standard: d. Analyze and interpret data to create graphic representations of the causes and effects of waves, currents, and tides in Earth s systems. Learning Target: I can explain the causes and effect of waves, currents, and tides. Warm-up: Chapter 15 Workbook Packet Work Session: Chapter 15 TB Lesson 3 (Currents); review ocean waves and tides; continue to research ocean floor topography (video); Lesson 3 Review p.554; Water on Earth Powerpoint Closing: TOD Reminders: Quiz Ocean waves, tides, currents
Thursday, December 1 Standard: d. Analyze and interpret data to create graphic representations of the causes and effects of waves, currents, and tides in Earth s systems. c. Ask questions to identify and communicate, using graphs and maps, the composition, location, and subsurface topography of the world s oceans. Learning Target: I can explain the causes and effect of waves, currents, and tides. Warm-up: Chapter 15 Workbook Packet Work Session: Chapter 15 TB Lesson 3 (Currents); review ocean waves and tides; continue to research ocean floor topography; Lesson 3 Review p.554; Water on Earth Powerpoint; Quiz Ocean waves, tides, currents Closing: Think Pair Share Reminders:
Friday, December 2 Standard: d. Analyze and interpret data to create graphic representations of the causes and effects of waves, currents, and tides in Earth s systems. c. Ask questions to identify and communicate, using graphs and maps, the composition, location, and subsurface topography of the world s oceans. Learning Target: I can explain the causes and effect of waves, currents, and tides. Warm-up: Chapter 15 Workbook Packet Work Session: Chapter 15 TB Lesson 3 (Currents); review ocean waves and tides; continue to research ocean floor topography; Closing: TOD Reminders:
Students will have 15 minutes of Homework each evening. 4 Squares (usually a drawing) Rock Cycle Puzzle Workbook Pages Powerpoint Study Guides Study Notes or Study Guides Watch Videos from Week at a Glance
Resources https://oceantoday.noaa.gov/watercycle/ https://www.geographyrealm.com/water-earth/ https://www.youtube.com/watch?v=QcteL7-0-74
S6E3. Obtain, evaluate, and communicate information to recognize the significant role of water in Earth processes. a. Ask questions to determine where water is located on Earth s surface (oceans, rivers, lakes, swamps, groundwater, aquifers, and ice) and communicate the relative proportion of water at each location. b. Plan and carry out an investigation to illustrate the role of the sun s energy in atmospheric conditions that lead to the cycling of water. (Clarification statement: The water cycle should include evaporation, condensation, precipitation, transpiration, infiltration, groundwater, and runoff.) c. Ask questions to identify and communicate, using graphs and maps, the composition, location, and subsurface topography of the world s oceans. d. Analyze and interpret data to create graphic representations of the causes and effects of waves, currents, and tides in Earth s systems.