Production & Service Systems Engineering Spring 2023
Methodological background for modeling workflow dynamics and resource allocation in modern operations, with a focus on production and service environments.

Download Presentation

Please find below an Image/Link to download the presentation.
The content on the website is provided AS IS for your information and personal use only. It may not be sold, licensed, or shared on other websites without obtaining consent from the author. Download presentation by click this link. If you encounter any issues during the download, it is possible that the publisher has removed the file from their server.
E N D
Presentation Transcript
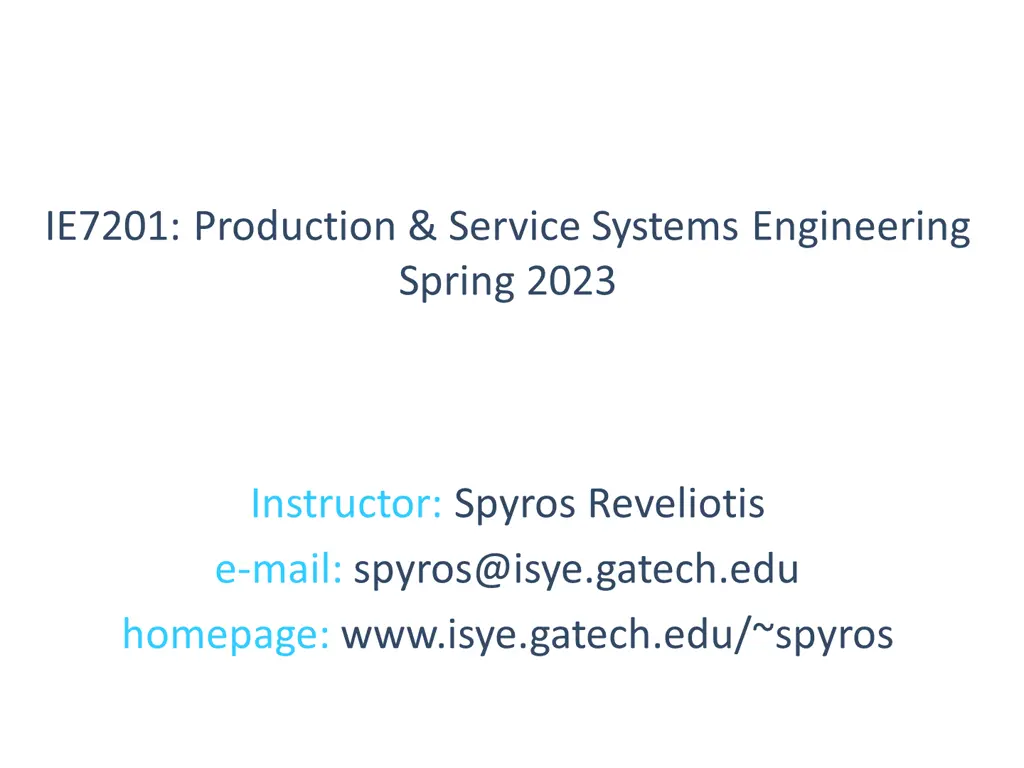
IE7201: Production & Service Systems Engineering Spring 2023 Instructor: Spyros Reveliotis e-mail: spyros@isye.gatech.edu homepage: www.isye.gatech.edu/~spyros
Course Logistics Office Hours: By appointment Course Prerequisites: ISYE 6761 (Familiarity with basic probability concepts and Discrete Time Markov Chain theory) ISYE 6669 (Familiarity with optimization concepts and formulations, and basic Linear Programming theory) Grading policy: Homework: 0% Two Midterm Exams: 33% each Final Exam: 34% Reading Materials: Course Textbook: Fundamentals of Queueing Theory (5thedition), by J. G. Shortle, J. M. Thompson, D. Gross and C. M. Harris, J. Wiley & Sons, Inc., 2018. Additional material will be distributed during the course development
Course Objectives Provide the student with methodological background that is necessary for modeling the workflow dynamics and the corresponding resource allocation problems taking place in modern operations. These operations can range from production and distribution environments to health care systems. Help the student, through examples and homework problems, to link the aforementioned theory to the targeted applications. Cultivate the student ability to apply effectively and rigorously the presented theory in the considered applications, and eventually in research.
Our basic view of the considered systems Production System: A transformation process (physical, locational, physiological, intellectual, etc.) Inputs Materials Capital Labor Manag. Res. Outputs Goods Services Organization The production system as a process network Stage 1 Stage 2 Stage 4 Suppliers Customers Stage 3 Stage 5
The major functional units of a modern organization Strategic Planning: defining the organization s mission and the required/perceived core competencies Finance/ Accounting: monitoring of the organization cash-flows Marketing: demand generation and order taking Production/ Operations: product/service creation
Corporate Mission The mission of the organization defines its purpose, i.e., what it contributes to society states the rationale for its existence provides boundaries and focus defines the concept(s) around which the company can rally Functional areas and business processes define their missions such that they support the overall corporate mission in a cooperative and synergistic manner.
Corporate Mission Examples Merck: The mission of Merck is to provide society with superior products and services-innovations and solutions that improve the quality of life and satisfy customer needs-to provide employees with meaningful work and advancement opportunities and investors with a superior rate of return. FedEx: FedEx is committed to our People-Service-Profit philosophy. We will produce outstanding financial returns by providing totally reliable, competitively superior, global air-ground transportation of high-priority goods and documents that require rapid, time-certain delivery. Equally important, positive control of each package will be maintained utilizing real time electronic tracking and tracing systems. A complete record of each shipment and delivery will be presented with our request for payment. We will be helpful, courteous, and professional for each other, and the public. We will strive to have a completely satisfied customer at the end of each transaction.
A strategic perspective on the operation of the considered systems Responsiveness (Reliability; Quickness; Flexibility; e.g., Dell, Overnight Delivery Services) Competitive Advantage through which the company market share is attracted Cost Leadership (Price; e.g., Wal-Mart, Southwest Airlines, Generic Drugs) Differentiation (Quality; Uniqueness; e.g., Luxury cars, Fashion Industry, Brand Name Drugs)
The course perspective: Modeling, analyzing and controlling workflows Some Key Performance measures Production rate or throughput, i.e., the number of jobs produced per unit time Production capacity, i.e., the maximum sustainable production rate Expected cycle time, i.e., the average time that is spend by any job into the system (this quantity includes both, processing and waiting time). Average Work-In-Process (WIP) accumulated at different stations Expected utilization of the station servers. Remark: The above performance measures provide a link between the directly quantifiable and manageable aspects and attributes of the system and the primary strategic concerns of the company, especially those of responsiveness and cost efficiency.
The underlying variability But the actual operation of the system is characterized by high variability due to a large host of operational detractors / contingencies; e.g., machine failures employee absenteeism lack of parts or consumables defects and rework planned and unplanned maintenance set-up times and batch-based operations Server Effective Processing Time to te
Some key issues to be addressed in this course How do I get good / accurate estimates of the performance of a certain system configuration? How do I design and control a system to support certain target performance? What are the attributes that determine these performance measures? What are the corresponding dependencies? Are there inter-dependencies between these performance measures and of what type? What target performances are feasible?
Queueing Theory: A plausible modeling framework Quoting from page 1 of your textbook: All of us have experienced the annoyance of having to wait in line. Unfortunately, this phenomenon continues to be common in congested, urbanized, high-tech societies. We, as customers, do not generally like these waits, and the managers of establishments at which we wait also do not like us to wait, since it may cost them business. Why then is there waiting? The answer is simple: There is more demand for service than there is facility for service available. Generally these limitations can be removed with the expenditure of capital, and to know how much service should then be made available, one would need to know answers to such questions as How long must a customer wait? and How many people will form in the line? Queueing theory attempts (and in many cases succeeds) to answer these questions through detailed mathematical analysis.
Factory Physics (a term coined by W. Hopp & M. Spearman) The employment of fundamental concepts and techniques coming from the area of queueing theory in order to characterize, analyze and understand the dynamics of (most) contemporary production systems.
Automation and the need for behavioral control R1 R2 R3 J1 :R1 R2 R3 J2 :R3 R2 R1
Another example: Traffic Management in an AGV System Type - 2 Deadlock W1 W2 Type - 1 Deadlock W3 W4 Docking Station
Behavioral or Logical vs Performance Control of Sequential RAS Resource Allocation System Behavioral Correctness Efficiency
An Event-Driven RAS Control Scheme Performance Control System State Model Logical Control Feasible Actions Admissible Actions Event Commanded Action Configuration Data RAS Domain
Theoretical foundations Control Theory Theoretical Computer Science Discrete Event Systems Operations Research
Course Outline 1. Introduction: Course Objectives, Context, and Outline Contemporary organizations and the role of Operations Management (OM) Corporate strategy and its connection to operations The organization as a resource allocation system (RAS) The underlying RAS management problems and the need for understanding the impact of the underlying stochasticity The basic course structure 2. Modeling and Analysis of Production and Service Systems as Continuous-Time Markov Chains A brief overview of the key results of the theory of Discrete-Time Markov Chains The Exponential Distribution and the Poisson Process Continuous-Time Markov Chains (CT-MC) Birth-Death Processes and the M/M/1 Queue Transient Analysis Steady State Analysis Modeling more complex behavior through CT-MCs Single station systems with multi-stage processing, finite resources and/or blocking effects Open (Jackson) and Closed (Gordon-Newell) Queueing networks
Course Outline (cont.) 3. Accommodating non-Markovian behavior Phase-type distributions and their role as approximating distributions The M/G/1 queue Priority Queues The G/G/1 queue The essence of Factory Physics 4. Performance Control of Production and Service systems Controlling the event rates of the underlying CT-MC model (an informal introduction of the dual Linear Programming formulation in standard MDP theory) A brief introduction of the theory of Markov Decision Processes (MDPs) and of Dynamic Programming (DP) An introduction to Approximate DP An introduction to dispatching rules and classical scheduling theory Buffer-based priority scheduling policies, Meyn and Kumar s performance bounds and stability theory
Course Outline (cont.) 5. Behavioral Control of Production and Service Systems Behavioral modeling and analysis of Production and Service Systems Resource allocation deadlock and the need for liveness-enforcing supervision (LES) Petri nets as a modeling and analysis tool A brief introduction to the behavioral control of Production and Service Systems
Analyzing a single workstation with deterministic inter-arrival and processing times Case I: ta = tp = 1.0 TH B1 M1 WIP 1 TH = 1 part / time unit Expected CT = tp t 1 2 3 4 5 Arrival Departure
Analyzing a single workstation with deterministic inter-arrival and processing times Case II: tp = 1.0; ta = 1.5 > tp TH B1 M1 WIP Starvation! 1 TH = 2/3 part / time unit Expected CT = tp t 1 2 4 5 3 Arrival Departure
Analyzing a single workstation with deterministic inter-arrival and processing times Case III: tp = 1.0; ta = 0.5 TH B1 M1 WIP 3 Congestion! 2 1 TH = 1 part / time unit Expected CT t 1 2 3 4 5 Arrival Departure
A single workstation with variable inter- arrival times Case I: tp=1; ta N(1,0.12) (ca= a / ta = 0.1) TH B1 M1 WIP 3 2 TH < 1 part / time unit Expected CT 1 t 1 2 3 4 5 Arrival Departure
A single workstation with variable inter- arrival times Case II: tp=1; ta N(1,1.02) (ca= a / ta = 1.0) TH B1 M1 WIP 3 2 TH < 1 part / time unit Expected CT 1 t 1 2 3 4 5 Arrival Departure
A single workstation with variable processing times Case I: ta=1; tp N(1,1.02) TH B1 M1 WIP 3 2 TH < 1 part / time unit Expected CT 1 t 1 2 3 4 5 Arrival Departure
Remarks Synchronization of job arrivals and completions maximizes throughput and minimizes experienced cycle times. Variability in job inter-arrival or processing times causes starvation and congestion, which respectively reduce the station throughput and increase the job cycle times. In general, the higher the variability in the inter-arrival and/or processing times, the more intense its disruptive effects on the performance of the station. The coefficient of variation (CV) defines a natural measure of the variability in a certain random variable.
The propagation of variability W1 W2 TH B1 M1 B2 M2 Case I: tp=1; ta N(1,1.02) Case II: ta=1; tp N(1,1.02) WIP WIP 3 3 2 2 1 1 t t 1 2 3 4 5 1 2 3 4 5 W1 arrivals W1 departures W2 arrivals
Remarks The variability experienced at a certain station propagates to the downstream part of the line due to the fact that the arrivals at a downstream station are determined by the departures of its neighboring upstream station. The intensity of the propagated variability is modulated by the utilization of the station under consideration. In general, a highly utilized station propagates the variability experienced in the job processing times, but attenuates the variability experienced in the job inter- arrival times. A station with very low utilization has the opposite effects.


")