Addressing Disability and School Attendance Gaps in Low- to Middle-Income Countries
Explore the challenges of disability in education and the gap in school attendance rates for children with disabilities in low- and middle-income countries. Learn about the determinants affecting school attendance and the methodology used to analyze disability data.

Download Presentation

Please find below an Image/Link to download the presentation.
The content on the website is provided AS IS for your information and personal use only. It may not be sold, licensed, or shared on other websites without obtaining consent from the author. If you encounter any issues during the download, it is possible that the publisher has removed the file from their server.
You are allowed to download the files provided on this website for personal or commercial use, subject to the condition that they are used lawfully. All files are the property of their respective owners.
The content on the website is provided AS IS for your information and personal use only. It may not be sold, licensed, or shared on other websites without obtaining consent from the author.
E N D
Presentation Transcript
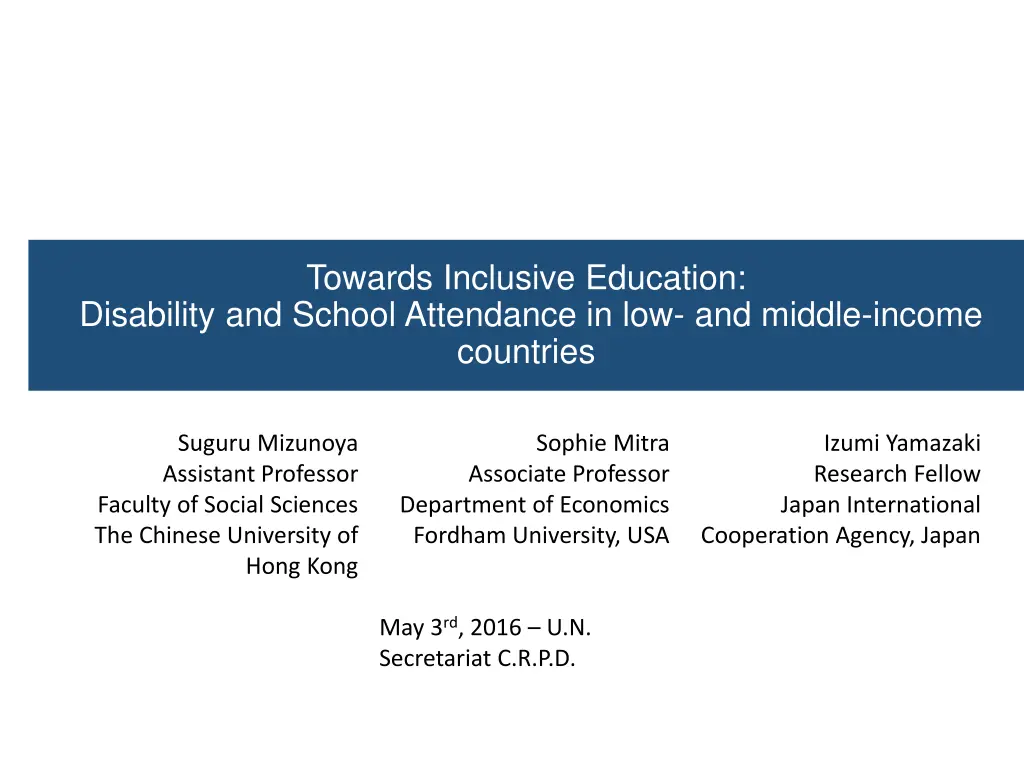
Towards Inclusive Education: Disability and School Attendance in low- and middle-income countries Suguru Mizunoya Assistant Professor Faculty of Social Sciences The Chinese University of Sophie Mitra Izumi Yamazaki Research Fellow Japan International Cooperation Agency, Japan Associate Professor Department of Economics Fordham University, USA Hong Kong May 3rd, 2016 U.N. Secretariat C.R.P.D.
Motivation Out-of-school children: one of the most critical issues in education today. CRPD, Article 24: equal rights to education for children with disabilities. High interest but lack of internationally comparable evidence Introduction
Research Questions How large and consistent is the gap in school attendance rates for children with and without disabilities in low- and middle-income countries? What are the determinants of school attendance for children with and without disabilities? Introduction
Measure of Disability By Washington Group Short Set (WGSS) 6 physical and mental domains Seeing Hearing Walking Concentrating Self-care Communication 4 degrees of functional ability No difficulty Yes, some difficulty Yes, a lot of difficulty Cannot do it at all Advantages Brief and internationally comparable Disadvantages Designed for adults: questionnaire for children not available in data yet Methodology
Data Lack of database of surveys with WGSS questions National household surveys & censuses in low- to middle- income countries Latest surveys conducted on or after 2006 only Sourced from International Household Survey Network (IHSN) Catalog United Nations Statistical Division (UNSD) repositories and archives Demographic and Healthy Survey (DSH) by USAID, etc. A total of 2,500 surveys screened for inclusion of WGSS questions Methodology
Data Out of 2,500 surveys, 42 surveys in 28 countries (<2 percent of initial) identified as fulfilling the eligibility criteria 28 surveys from 21 countries (67 percent of 42 surveys) were compiled from 2010 18 surveys from 15 countries are used for this study Methodology
Analytical Methodology: Descriptives Prevalence rate of disability For primary, secondary, entire school-age group, entire aged 5 and over population ???????????????= ????????????????? ???????????????? Proportion of OOS Children For disabled, non-disabled, and all children ????????????? ?????????????? ??????? ?????????????????= Disability gap in attendance = Difference between disabled and non- disabled Methodology
Analytical Methodology: Econometric models Logistic regression to estimate disability s marginal effect on attendance Pr ??= 1=logit 1(?0+ ?1Age?+ ?2Age? + ?5Socioeconomic Status?+ ?6Disability?) 2+ ?3Male?+ ?4Rural? where , = dichotomous outcome variable of school attendance for school-age child , (1 = currently in school, 0 = otherwise) = age entered in linear and quadratic forms as a control variable = dummy variable for sex (1 = boys, 0 = otherwise) = dummy variable for residential location, equaling 1 for rural residents, and 0 otherwise = dummy variable indicating disability status (1 = disabled under the study definition, 0 otherwise) Marginal effect MEdisability= Pr ??= 1|Disability?= 1 Pr ??= 1|Disability?= 0 Methodology
Analytical Methodology: Econometric Second logistic regression including interaction terms Pr ??= 1=logit 1[?0+ ?1Age?+ ?2Age? + ?6Disability?+ ?7(Disability? Male?) + ?8(Disability? Rural?) + ?9(Disability? Socioeconomic Quintile?)] 2+?3Male?+ ?4Rural?+ ?5Socioeconomic Status? ?3+ ?7 ?4+ ?8 ?5+ ?9 Household fixed-effects linear probability model for quartile regression: 2+ ?3Male?+ ?4Disability?+ ?{household dummies} ??= ?0+ ?1Age?+ ?2Age? Methodology
Results: Disability Prevalence, Primary and Secondary-age Children 12% 10% 10% 8% 6% 6% 5% 4% 4% 4% 4% 3% 3% 3% 3% 2% 2% 2% 2% 1% 1% 1% 1% 0% Results
OOSC Rates by Disability Status (Combined Primary and Secondary-age) 80% 70% 60% 50% 40% 30% 20% 10% 0% Non-disabled Disabled Results
Ratio of Disabled to Non-disabled OOSC Rates (Primary-age Only) 18 16 16 15.1 13.8 14 12 11.110.9 10 8 7.2 6.8 6 4.2 4.1 3.9 3.7 3.5 4 3.3 3.1 2.9 2.2 1.9 1.7 1.5 2 0 Results
Breakdown of OOS Children Never Attended School vs. Dropout (Combined Primary and Secondary-age) 80% 70% 60% 50% 40% 30% 20% 10% 0% Never attended Dropped out Results
Results: Logit model of attendance (Primary+ Secondary) Disability coefficient is negative and significant in all countries Reduction ranges from -5.3 percent (South Africa, 2011) to -61.0 percent (Indonesia) Little gender difference exists in marginal effect Results
Results: Decomposition of the gap in attendance rates The gap is largely unexplained by differences in the distributions of observed characteristics. The unexplained gap is the smallest in Albania (85.6%).
Results: Household Fixed Effect Model The median marginal effect of disability: - 30.9 percentage points. Little difference by socioeconomic quartile.
Summary of Findings 1. The median difference of OOSC rates between children with and without disabilities in primary and secondary education stands at 25.9 and 23.8 percentage points, respectively. 2. Differences in OOSC rates and ratios between children with and without disabilities among primary-age children are larger than among secondary-age children. 3. Attainment of initial access to education for children with disabilities is a significant challenge. 4. The size of the disability gap in OOSC for primary- age children follows an inverted U-shape relationship with GNI per capita. 5. Differences in observed characteristics across disability status using a logistic or decomposition model do not explain the disability gap in attendance rates. Summary of Findings
Implications of Findings Results from this paper show the existence of a problem, the disability gap in school attendance. It can rule out that the gap is not due to differences in gender, age, geographic location and socioeconomic status and point towards barriers in the general environment and in schools. Further research should investigate the root causes of the disability gap in schooling in a more specific manner. More data is needed on children, disability and schooling. Attendance is the minimal measure of education achievement. Summary of Findings
Results: Disability Prevalence Primary-age children Generally low, does not surpass 1.5 percent in 13/18 surveys Exceptions Uganda (2,9 in 2011), South Africa (4.5 in 2013), Maldives (5 percent in 2009) Secondary-age children Also low, does not surpass 2.0 percent in 15/17 surveys Exceptions Uganda (2.4 in 2011), Maldives (5.5 in 2009) Prevalence in aged 5 and above group is more than twice of the total school-age population. (Note: Possible underestimation in mental health)
Details of Analyzed Survey Data SECONDARY-SCHOOL CHILDREN PRIMARY-SCHOOL CHILDREN COUNTRY [WB Income Group at survey time] L: low LM: lower middle UM: upper middle YEAR(S) OF FIELD-WORK SURVEY NAME Size of Sample (disabled persons) Size of Sample(disabled persons) Age Age Indonesia [LM] 2,764,413 (8,314) 3,527 (33) 3,146 (25) 3,305 (24) 13,573 (129) 22,476 (337) 7,416 (44) 33,597 (141) 5,819 (293) 4,637 (36) 13,562 (80) 5,052 (23) 2,546,893 (7,179) 2,007 (33) 6,736 (66) 1,551 (10) 2010 Population Census (10% sample) 7-12 13-18 2009-2011 Papua New Guinea [LM] Household Income and Expenditure Survey (HIES) 9-14 15-18 2006 Viet Nam [L] Household Living Standards Survey (HLSS) 6-10 11-17 2012 Albania [LM] Living Standards Measurement Survey (LSMS) 6-14 15-17 Saint Lucia [UM] West Bank and Gaza [LM] 2010 Population and Housing Census 5-11 data unavailable for analysis 4,689 (94) 8,359 (59) 18,752 (79) 5,190 (280) 1,685 (17) 5,004 (20) 3,981 (15) 9,275 (126) 456,022 (8,508) 3,010 (28) 4,756 (51) 6,318 (150) 2,588 (41) 2011 Disabled Individuals Survey 6-15 16-17 2010 Bangladesh [L] Housing Income and Expenditure Survey (HIES) 6-10 11-17 6-13b, 6-12 14-17b, 13-17 2005 India [L] Health and Development Survey (HDS) Maldives [UM] 2009 Demographic and Health Survey (DHS) 6-12 13-17 Rural Socio-economic Survey (ERSS) [rural and small town areas only] 2011-2012 Ethiopia [L] 7-14 15-18 2010-2011 Malawi [L] Third Integrated Household Survey (IHS3) 6-13 14-17 2012- 2013 Nigeria [LM] General Household Panel Survey (GHS-Panel), Wave 2 6-11 12-17 South Africa [UM] South Africa [UM] 2013 General Household Survey 7-13 12,958 (464) 14-19 434,165 (21,443) 3,710 (23) 6,722 (79) 10,382 (271) 3,455 (36) 2011 Census (10% sample) 7-13 14-19 2010-2011 Tanzania [L] National Panel Survey (NPS) 7-13 14-19 2008 Tanzania [L] Disability Survey 7-13 14-19 2011 Uganda [L] Demographic and Health Survey (DHS) 6-12 13-18 2010-2011 Uganda [L] National Panel Survey, Wave 2 (NPS) 6-12 13-18
Primary-Age OOSC by Disability Status DIFFERENCEIN OOSC PROPORTIONSBY DISABILITY STATUS (4) = (3) (2) PROPORTIONOF OOSC SIZEOF PRIMARY-AGED SAMPLE (disabled persons) RATIOOF OOSC PROPORTIONS BY DISABILITY STATUS (5) = (3) / (2) COUNTRY Overall (1) Non-Disabled (2) Disabled (3) East Asia and the Pacific 49.2%*** (9.38%) 18.0%* (9.51%) 25.0%** (9.38%) 2,764,413 (8,314) 3,527 5.1% 5.0% 54.1% (0.55%) 51.6% (9.47%) 29.2% (9.38%) 10.9 Indonesia (0.01%) 33.7% (0.79%) 4.5% (0.37%) (0.01%) 33.6% (0.79%) 4.3% (0.37%) 1.5 Papua New Guinea (33) 3,146 (25) 6.8 Viet Nam Europe and Central Asia 62.3%*** (8.19%) 3,305 (24) 10.6% (0.49%) 10.1% (0.48%) 72.4% (8.18%) 7.2 Albania Latin America and the Caribbean 13,253 (128) 23.9%a 15.1a Saint Luciaa 1.9%a 1.7%a 25.6%a Middle East and North Africa 30.0% (2.55%) 22,476 (337) 2.5% 2.0% 32.0% (2.55%) 16.0 West Bank and Gaza (0.10%) (0.09%) South Asia 48.1%*** (7.40%) 33.5%*** (4.58%) 9.2%*** (1.83%) 7,413 (43) 33,515 (138) 5,786 (291) 15.2% (0.42%) 11.8% (0.17%) 1.3% (0.15%) 14.9% (0.41%) 11.6% (0.17%) 0.9% (0.13%) 63.1% (7.39%) 45.1% (4.58%) 10.0% (1.82%) 4.2 Bangladesh 3.9 India 11.1 Maldives Sub-Saharan Africa 30.3%*** (7.42%) 30.8%*** (5.63%) 50.4%*** (12.09%) 6.4%*** (1.28%) 3.7%*** (0.18%) 42.9%*** (9.32%) 39.6%*** (5.88%) 7.5%*** (2.23 %) 25.9%*** (7.59 %) 29.8% 4,611 (36) 13,542 (80) 4,818 (19) 12,679 (454) 497,142 (22,305) 3,704 34.4% (0.69%) 13.4% (0.29%) 18.8% (0.58%) 0.7% (0.08%) 3.4% (0.03%) 14.0% (0.56%) 19.3% (0.49%) 10.5% (0.30%) 14.0% (0.60%) 12.0% 34.1% (0.69%) 13.2% (0.29 %) 18.6% (0.58%) 0.5% (0.08%) 3.2% (0.03%) 13.7% (0.56%) 18.8% (0.49%) 10.3% (0.30%) 13.7% (0.60%) 11.7% 64.4% (7.39%) 44.0% (5.63%) 69.1% (12.07%) 6.9% (1.28%) 7.0% (0.17%) 56.6% (9.30%) 58.4% (5.86%) 17.8% (2.21%) 39.7% (7.57%) 41.5% 1.9 Ethiopia, rural 3.3 Malawi 3.7 Nigeria South Africa (2013) South Africa (2011) Tanzania (2010-11) Tanzania (2008) Uganda (2011) Uganda (2010-11) Mean 13.8 2.2 4.1 (23) 6,712 (79) 10,376 (271) 3,410 (36) 3.1 1.7 2.9 3.5
Secondary-age OOSC by Disability Status DIFFERENCEIN OOSC PROPORTIONSBY DISABILITY STATUS (4) = (3) (2) RATIOOF OOSC PROPORTIONSBY DISABILITY STATUS (5) = (3) / (2) PROPORTIONOF OOSC SIZEOF PRIMARY-AGED SAMPLE (disabled persons) COUNTRY Overall (1) Non-Disabled (2) Disabled (3) East Asia and the Pacific 50.1%*** (0.47%) 42.6%*** (7.01%) 50.3%*** (5.78%) 2,546,893 (7,179) 2,006 30.9% (0.03%) 42.5% (1.13%) 19.1% (0.48%) 30.8% (0.03%) 41.8% (1.13%) 18.6% (0.48%) 80.9% (0.46%) 84.5% (6.92%) 68.9% (5.76%) 2.6 Indonesia 2.0 Papua New Guinea (33) 6,736 (66) 3.6 Viet Nam Europe and Central Asia 37.5%** (14.6%) 1,551 (10) 16.5% (0.95%) 16.2% (0.95%) 53.6% (14.6%) 3.3 Albania Middle East and North Africa 33.7% (5.39%) 4,689 (94) 17.6% (0.58%) 16.9% (0.58%) 50.6% (5.36%) 3.0 West Bank and Gaza South Asia 46.1%*** (6.24%) 22.0%*** (5.38%) 8.4%*** (2.18%) 8,359 (59) 18,684 (79) 5,161 (272) 28.2% (0.50%) 39.3% (0.36%) 6.6% (0.35%) 27.9% (0.50%) 39.2% (0.36%) 6.2% (0.35%) 74.0% (6.22%) 61.2% (5.37%) 14.6% (2.16%) 2.7 Bangladesh 1.6 India 2.4 Maldives Sub-Saharan Africa 51.0%*** (4.00%) 46.5%*** (10.41%) 9.3% (12.74%) 23.8%*** (4.81%) 8.7%*** (0.50%) 9.7% (9.40%) 43.1%*** (5.04%) 15.6%*** (3.98%) 22.6%** (8.76%) 30.6% 1,681 (17) 5,000 (20) 3,839 (13) 9,074 (120) 378,537 (6,699) 3,009 (28) 4,754 (51) 6,309 (150) 2,553 (41) 47.5% (1.21%) 21.8% (0.59%) 18.4% (0.64%) 9.8% (0.32%) 12.1% (0.05%) 49.7% (0.92%) 41.5% (0.73%) 20.6% (0.51%) 20.1% (0.80%) 26.0% 47.0% (1.21%) 21.6% (0.59%) 18.3% (0.64%) 9.5% (0.32%) 11.9% (0.05%) 49.6% (0.93%) 40.9% (0.74%) 20.2% (0.51%) 19.8% (0.80%) 25.7% 98.0% (3.82%) 68.0% (10.39%) 27.6% (12.73%) 33.3% (4.80%) 20.7% (0.50%) 59.3% (9.35%) 84.0% (4.99%) 35.8% (3.94%) 42.4% (8.72%) 56.3% 2.1 Ethiopia, rural 3.1 Malawi 1.5 Nigeria South Africa (2013) South Africa (2011) Tanzania (2010-11) Tanzania (2008) Uganda (2011) Uganda (2010-11) Mean 3.5 1.7 1.2 2.1 1.8 2.1 2.4
Disability Prevalence by Age Group Ratio of Disability Prevalence in Overall Population to that in School Age Children (5) = (4) / (3) Primary- and Secondary-Age Children Combined (3) Primary-Age Children (1) Secondary-Age Children (2) Overall Population Aged 5+ (4) COUNTRY Indonesia 0.3% (0.00%) 0.3% (0.00%) 0.3% (0.00%) 0.8% (0.00%) 2.7 Papua New Guinea 0.8% (0.15%) 1.5% (0.27%) 1.0% (0.14%) 6.3% (0.17%) 6.3 Vietnam Albania Saint Luciaa 0.8% (0.16%) 0.8% (0.14%) 1.0% 1.0% (0.12%) 0.8% (0.23%) 0.9% (0.10%) 0.8% (0.12%) 3.6% (0.10%) 1.8% (0.09%) 3.9% 4.0 2.3 / data unavailable for analysis West Bank and Gaza 1.5% (0.08%) 2.0% (0.21%) 1.6% (0.08%) 2.7% (0.06%) 1.7 Bangladesh Indiab Maldives Ethiopia, rural Malawi Nigeria 0.6% (0.09%) 0.4%b (0.03%) 5.0% (0.29%) 0.9% (0.14%) 0.6% (0.06%) 0.4% (0.09%) 0.6% (0.09%) 0.4% (0.05%) 5.5% (0.32%) 0.8% (0.22%) 0.4% (0.09%) 0.4% (0.10%) 0.6% (0.06%) 0.4%b (0.03%) 5.2% (0.22%) 0.9% (0.12%) 0.5% (0.05%) 0.4% (0.07%) 1.6% (0.06%) 0.9%b (0.02%) 9.7% (0.15%) 2.5% (0.12%) 1.1% (0.05%) 1.2% (0.07%) 2.7 2.3 1.9 2.8 2.2 3.0 South Africa (2013) 3.3% (0.16%) 1.1% (0.11%) 2.4% (0.10%) 3.5% (0.06%) 1.5 South Africa (2011) 4.5% (0.03%) 1.8% (0.02%) 3.3% (0.02%) 4.4% (0.01%) 1.3 Tanzania (2010-11) 0.8% (0.14%) 1.0% (0.18%) 0.9% (0.11%) 2.6% (0.12%) 2.9 Tanzania (2008) 1.1% (0.13%) 1.2% (0.16%) 1.1% (0.10%) 2.2% (0.09%) 2.0 Uganda (2011) 2.9% (0.16%) 2.4% (0.19%) 2.7% (0.12%) 4.9% (0.11%) 1.8 Uganda (2010-11) 1.3% (0.19%) 1.3% (0.23%) 1.3% (0.15%) 2.6% (0.14%) 2.0 Mean 1.4% 1.3% 1.4% 3.1% 2.6
Fairlie Non-Linear Decomposition Fairlie non-Linear decomposition of disability gap in attendance ??? ?? ?? ?? ??? ?? ??? ?? ?? ?? ?? ?? ?? ?? ? ?? ? ?? ? ?= ? ?? ? ?? + ? ?? ? ?? ?=1 ?=1 ?=1 ?=1 ??? and ?? disabled (D) ?? = logistic regression estimated coefficients for non-disabled (ND) and ?? and ?? = observed characteristics in ND and D ?