AHCCCS Targeted Investments Program Quality Improvement Workgroup Steps & Metrics
Explore the framework and steps involved in the AHCCCS Targeted Investments Program Quality Improvement Workgroup, focusing on developing aim statements, identifying obstacles, interventions, measures, and evaluation methods. Discover how to ramp up PDSA cycles, monitor metrics, review dashboards, and analyze opportunities for improvement.

Uploaded on | 0 Views
Download Presentation

Please find below an Image/Link to download the presentation.
The content on the website is provided AS IS for your information and personal use only. It may not be sold, licensed, or shared on other websites without obtaining consent from the author. If you encounter any issues during the download, it is possible that the publisher has removed the file from their server.
You are allowed to download the files provided on this website for personal or commercial use, subject to the condition that they are used lawfully. All files are the property of their respective owners.
The content on the website is provided AS IS for your information and personal use only. It may not be sold, licensed, or shared on other websites without obtaining consent from the author.
E N D
Presentation Transcript
AHCCCS Targeted Investments Program Quality Improvement Workgroup Session 3 Template Slides TIP Year 6: Quality Improvement Workgroup Series March 7 & 14, 2022 1
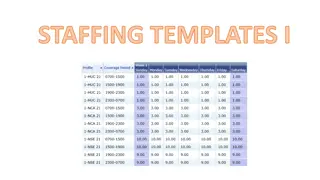
QI Steps Covered 1. 2. Develop Aim Statement Identify and Prioritize Obstacles (what to change) Identify Intervention (how to change) Establish Measures (measuring progress of change) Establish Plan-Do-Study-Act (PDSA) Ramp and Define PDSA cycles Plan: Develop Do: Implement Study: Evaluate Act: Lock-in or Revise & Re-do Define Metrics 7. Review Progress on PDSA Cycles 8. Monitor Metrics 3. 4. 5. 6. Template slides included in this PPT are bolded
Additional Suggested Homework 1. 2. Review the ARCS Dashboards Opportunity Analysis Template slides included in this PPT are bolded 3
Ramp #1: PDSA Cycles Aim: Increase the 7-day follow-up after hospitalization (FUH) rate ___ percentage points (__% to __%) from ____ to ___ Goal: Cycle 1: Cycle 2: Cycle 3: Cycle 4: Plan Who? What? Where? When? Do How? Study Evaluate Act Monitor or Revise 4 4
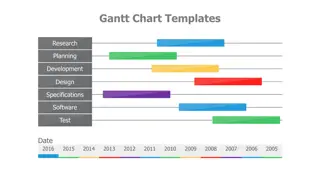
PDSA Ramp #1 P P D D A A S S P P A A D D P P S S A A Cycle 6 TBD P D D P D D A S S A S S Cycle 5 TBD P P D D A A S S Cycle 4 TBD P P D D A A S S Cycle 3 TBD Cycle 2 TBD Cycle 1 TBD 5 5
Monitor Metrics Metrics Cycle #1 Numerator/Denominator Week 1 Week 2 Week 3 Week 4 Week 5 Week 6 Cycle 2: Cycle #3: Cycle #4: 6 6
Review the ARCS Dashboards 1. Go to data.tipqic.org and sign in 2. Navigate to Explore TIPQIC Provider Dashboards ARCS Dashboards 3. You will see a number of tiles, one for each ARCS dashboard available to you. Click on one to open and view the dashboard 4. Once you ve opened one, you can navigate between the dashboards using the tabs at the top of the dashboard (see image) 7
Opportunity Analysis Measure Met? ARCS Analysis Care Process Estimated Patient Count Estimated Patient % Opportunity by Patient Count Target Yes No Improvement Gain Goal (%) Patient Count % Patient Count % 8