AHCCCS Update Enrollment Data 2014-2016
AHCCCS experienced fluctuations in enrollment data from 2014 to 2016, with notable changes in the number of members across different healthcare programs. Overall, there was an increase in enrollment, but with variations in specific categories. The update highlights the growth and decline in enrollment figures over the mentioned period.

Download Presentation

Please find below an Image/Link to download the presentation.
The content on the website is provided AS IS for your information and personal use only. It may not be sold, licensed, or shared on other websites without obtaining consent from the author.If you encounter any issues during the download, it is possible that the publisher has removed the file from their server.
You are allowed to download the files provided on this website for personal or commercial use, subject to the condition that they are used lawfully. All files are the property of their respective owners.
The content on the website is provided AS IS for your information and personal use only. It may not be sold, licensed, or shared on other websites without obtaining consent from the author.
E N D
Presentation Transcript
Enrollment Data 2014-2016 increased 32 of 36 months Overall increase of 618,000 members Non-KidsCare Enrollment in 2017 down (33,000) KidsCare growth of 11,000 Growth decreased 4 of past 5 months Reaching across Arizona to provide comprehensive quality health care for those in need 2
Budget Update FY 2019 Budget Exec - $35 m higher hospital assessment Exec includes savings for prior quarter and non-contracted IP psych rates Modest differences on cap rate assumptions More savings from Health Ins. Fee CHIP/KidsCare will be a 2019 Legislative Issue Reaching across Arizona to provide comprehensive quality health care for those in need 3
Length of US Economic Expansions Reaching across Arizona to provide comprehensive quality health care for those in need 4
Opioid Epidemic Special Session Working with RBHAs on allocation of $10m $10 m targeted for Non TXIX population TXIX services Two Phases First Phase looking to get dollars out quickly Second phase will include stakeholder input Reaching across Arizona to provide comprehensive quality health care for those in need 5
Targeted Investments Year 1 payments Thanks for quick turnaround on Payments BH 210 sites - $9.9 m PH 270 sites - $5.4 m Hospitals 27 sites - $1.0 m Justice 9 co-located integrated clinics - $2.7 m Reaching across Arizona to provide comprehensive quality health care for those in need 6
ACC Actuarial Timeline June Member letters go out late in month with assignments - Actuarial team notified late in month of passive assignments - Actuarial team preliminary rates ready July 30 days member choice through end of month July Preliminary rates sent to MCOs based ONLY on passive assignment August (early) Actuarial team notified of choice decisions and member movement; adjust MCO rates for revised placement including acuity adjustment September 1st-ish Final rates sent to MCOs based on passive assignment and choice decisions Reaching across Arizona to provide comprehensive quality health care for those in need 7
American Indian Enrollment for GMH/SA and Children Populations Current Health Plan Enrollment/Assignment CRS (acute and CRS services), TRBHA Enrollment on 10/1/2018 with Choice ACC Plan AIHP, CRS (CRS services only) and TRBHA AIHP and TRBHA AIHP, CRS and RBHA AIHP AIHP and TRBHA AIHP and TRBHA No Change AIHP and RBHA AIHP Acute MCO and TRBHA ACC Plan Acute MCO and RBHA ACC Plan CMDP and TRBHA CMDP and TRBHA- No Change DDD and TRBHA DDD and TRBHA-No Change
Other RFPs Hemophilia award any day TPL RFP award 6-1-18 FFS PBM award 4-1-18 Electronic Visit Verification award 5-31-18 SMI Eligibility Determination award 7-2-18 Provider Management System award 5-30- 18 Asset Verification - ? Reaching across Arizona to provide comprehensive quality health care for those in need 10
Prop 206 Study Findings There was already variation in network adequacy prior to Prop 206. Limited access was found for just a few services impacting less than 5% of ALTCS members. o Among services where provider owns the residence (NFs, assisted living, DDD group homes), only 9 of 48 geographic locations studied had no residential offering. o Among in-home or community-based services, when examining county/service combinations, 5 of 104 had very limited access; another 5 had limited access; 92 had sufficient access. Reaching across Arizona to provide comprehensive quality health care for those in need 11
Findings (continued) Prop 206 and the Flagstaff Prop have added fiscal stress to providers. o Respondents from both the EPD and DDD surveys stated that they had to raise their starting salaries for paraprofessionals to meet the minimum wage floor on Jan 1, 2017. HCBS providers for EPD services increased on average 9.4% Assisted living providers increased on average 12.4% Nursing facilities increased nurse aide wages 5.2% Providers for I/DD services increased wages 6.1% to 8.6% depending upon the labor category o Respondents stated that they have leveraged all available options to cover the minimum wage increases. Reduce other staff benefits (to minimum wage and non-minimum wage staff) Reduce overall staffing Reaching across Arizona to provide comprehensive quality health care for those in need 12
Prop 206 Impact Study Turnover Rate Among I/DD Agency Providers, First Half of CY 2017, Based on Agency Size Turnover Rate = # Departures in First 6 Months of CY 2017 divided by Number of Staff on 7/1/17 50% 40% 30% 20% 10% 0% All Respondents (n=211) Agencies with up to 10 Staff (n=31) Agencies with 11-25 Staff (n=40) Agencies with 26-50 Staff (n=42) Agencies with > 50 Staff (n=98) Reaching across Arizona to provide comprehensive quality health care for those in need 13
Uninsured Rate, 2012-2016 20.0% 17.4% 17.3% 13.6% 15.0% 11.1% 9.9% 14.7% 14.4% 10.0% 11.6% 9.4% 8.5% 5.0% 0.0% 2012 2013 2014 2015 2016 Arizona United States Reaching across Arizona to provide comprehensive quality health care for those in need 14
Percent of Spend in Managed Care Percent of Medicaid Spending Paid by Capitation, FFY2016 State Rank in Percentage of Medicaid Expenditures Paid via Capitation FFY2016 Medicaid Spending FFY2016 Capitated State Spending Kansas Hawaii Arizona Delaware New Mexico Florida Kentucky Michigan Tennessee Washington Oregon New Jersey Pennsylvania Rhode Island Ohio New York Louisiana $3,252,725,194 $2,156,012,061 $11,118,985,133 $1,883,220,982 $5,339,766,195 $21,689,957,388 $9,609,364,927 $16,714,754,874 $9,463,742,287 $10,787,810,275 $8,316,707,109 $14,319,021,372 $27,350,279,117 $2,411,382,026 $21,571,025,591 $60,995,857,591 $8,536,666,882 $3,029,662,373 $1,938,658,711 $9,683,119,933 $1,616,107,823 $4,461,697,022 $15,706,906,241 $6,878,104,559 $10,963,275,584 $6,119,439,351 $6,516,952,134 $5,005,544,493 $8,528,400,366 $16,108,824,996 $1,385,986,104 $11,895,433,176 $32,171,587,918 $4,450,521,745 93.1% 89.9% 87.1% 85.8% 83.6% 72.4% 71.6% 65.6% 64.7% 60.4% 60.2% 59.6% 58.9% 57.5% 55.1% 52.7% 52.1% 1 2 3 4 5 6 7 8 9 10 11 12 13 14 15 16 17 Source: The Menges Group Reaching across Arizona to provide comprehensive quality health care for those in need 15
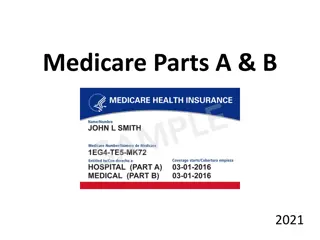
MACStats Data Medicaid National per enrollee spend o $7,248 Arizona o $5,867 second lowest for expansion states National Generic Rate - 82.7% Arizona 86.1% - second highest to RI Rebates TN and MA spend about the same on drugs before rebates - $100 m more in rebates Reaching across Arizona to provide comprehensive quality health care for those in need 17
AHCCCS Generations in workplace (2013) 1.6% Traditionalists Traditionalists Born: 1927-1945 Baby Boomers Born: 1946-1964 Gen X Born: 1965-1976 Gen Y Millennium Born: 1977-1995 17.6% Gen Y 50.7% Boomers 30.0% Gen X Total # of employees: 936 Reaching across Arizona to provide comprehensive quality health care for those in need 18
AHCCCS Generations in the Workplace 2017 Reaching across Arizona to provide comprehensive quality health care for those in need 19


")


")