Analysis of Bacterial Species and Birth Outcomes Correlation
Explore the correlation between bacterial species and birth outcomes, including the impact of oral cleaning habits and maternal age. The study involves analyzing sequences, bacterial copy numbers, and birth data. The findings contribute to understanding factors affecting maternal and newborn health.
Download Presentation

Please find below an Image/Link to download the presentation.
The content on the website is provided AS IS for your information and personal use only. It may not be sold, licensed, or shared on other websites without obtaining consent from the author. If you encounter any issues during the download, it is possible that the publisher has removed the file from their server.
You are allowed to download the files provided on this website for personal or commercial use, subject to the condition that they are used lawfully. All files are the property of their respective owners.
The content on the website is provided AS IS for your information and personal use only. It may not be sold, licensed, or shared on other websites without obtaining consent from the author.
E N D
Presentation Transcript
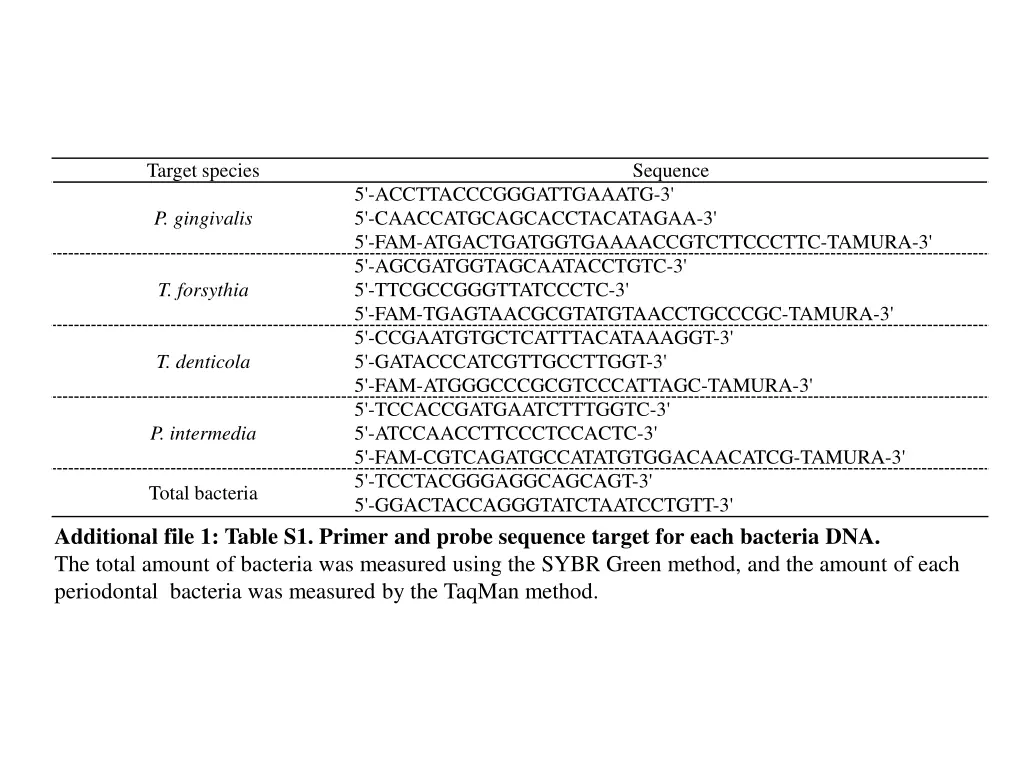
Target species Sequence 5'-ACCTTACCCGGGATTGAAATG-3' 5'-CAACCATGCAGCACCTACATAGAA-3' 5'-FAM-ATGACTGATGGTGAAAACCGTCTTCCCTTC-TAMURA-3' 5'-AGCGATGGTAGCAATACCTGTC-3' 5'-TTCGCCGGGTTATCCCTC-3' 5'-FAM-TGAGTAACGCGTATGTAACCTGCCCGC-TAMURA-3' 5'-CCGAATGTGCTCATTTACATAAAGGT-3' 5'-GATACCCATCGTTGCCTTGGT-3' 5'-FAM-ATGGGCCCGCGTCCCATTAGC-TAMURA-3' 5'-TCCACCGATGAATCTTTGGTC-3' 5'-ATCCAACCTTCCCTCCACTC-3' 5'-FAM-CGTCAGATGCCATATGTGGACAACATCG-TAMURA-3' 5'-TCCTACGGGAGGCAGCAGT-3' 5'-GGACTACCAGGGTATCTAATCCTGTT-3' P. gingivalis T. forsythia T. denticola P. intermedia Total bacteria Additional file 1: Table S1. Primer and probe sequence target for each bacteria DNA. The total amount of bacteria was measured using the SYBR Green method, and the amount of each periodontal bacteria was measured by the TaqMan method.
Bacteria species Variables Age of mother Birth weight Birth length Gestational age Gender of newborn Age of mother Birth weight Birth length Gestational age Gender of newborn Age of mother Birth weight Birth length Gestational age Gender of newborn Age of mother Birth weight Birth length Gestational age Gender of newborn Age of mother Birth weight Birth length Gestational age Gender of newborn Correlation coefficient (r) p value 0.0503 -0.0858 0.0685 - - 0.1756 -0.0260 0.1570 - - 0.1180 -0.0896 0.1246 - - 0.0278 -0.1234 0.2020 - - 0.0796 -0.0709 0.0515 - - 0.4852 0.2298 0.2709 0.9266 0.4917 0.2717 0.5577 0.1922 0.4650 0.0046 0.3158 0.4024 0.1375 0.9404 0.0585 0.7129 0.4613 0.0416 0.4509 0.0003 0.4535 0.6424 0.8903 0.2896 0.4312 Total bacteria P. gingivalis T. forsythia T. denticola P. intermedia Additional file 1: Table S2. Correlation between the copy number of each bacteria and each birth outcomes by univariate analysis. This table shows the Spearman's correlation coefficient (r) and the results of univariate analysis (p value) by linear regression analysis or wilcoxon rank sum test to analyze the relationship between the copy number of each bacteria and birth outcomes. We used wilcoxon rank sum test for binary variables
Age group 30s 14 (20.3) 55 (79.7) 15 (21.7) 54 (78.3) 62 (89.9) 7 (10.1) 14 (20.3) 55 (79.7) Oral cleaning habit p value ~20s 20 (30.3) 46 (69.7) 22 (32.8) 45 (67.2) 60 (89.6) 7 (10.4) 5 (7.5) 62 (92.5) 40s 2 or 3 times 1 times 3 month 6 month or over Brush+Paste Others Yes No 3 (17.6) 14 (82.4) 2 (11.8) 15 (88.2) 10 (58.8) 7 (41.2) 3 (17.6) 14 (82.4) Frequency of brushing 0.1494 Frequency of replacement 0.0430 Cleaning method 0.0153 Dental examination history 0.0722 Additional file 1: Table S3. Correlation between oral cleaning habits and maternal age. In this table, data are shown as n (%), and the results of the Cochrane-Armitage test are shown as p values.
180 167.0 160 Dentists (per 100,000 population) 140 120 100 85.5 81.1 80.0 80 65.1 61.0 60.2 60 44.6 37.2 40 15.0 20 9.7 1.9 1.6 0 Additional file 1: Figure S1. Dentists per population in each country in 2018. This figure was made using WHO data (38). Cuba has the highest number of dentists per population, and many developing countries in Africa and Southeast Asia, including Rwanda, have less than ten dentists per 100,000 population.


