Andrews University School of Education Assessment 2012-2013 Overview
Explore the assessment report for Andrews University School of Education in the academic year 2012-2013. Learn about the programs offered, candidate enrollments, and more. Find insights into departmental assessment, job placements, and plans for improvement.

Download Presentation

Please find below an Image/Link to download the presentation.
The content on the website is provided AS IS for your information and personal use only. It may not be sold, licensed, or shared on other websites without obtaining consent from the author. If you encounter any issues during the download, it is possible that the publisher has removed the file from their server.
You are allowed to download the files provided on this website for personal or commercial use, subject to the condition that they are used lawfully. All files are the property of their respective owners.
The content on the website is provided AS IS for your information and personal use only. It may not be sold, licensed, or shared on other websites without obtaining consent from the author.
E N D
Presentation Transcript
Andrews University School of Education Assessment Report 2012-2013
Outline of Annual Report Overview of SED Departments & Programs Assessment Report/Summary of Data Break for Dinner Job Placements of Recent Grads MTTC Score Trends Closing the Loop Plans for Improvement Outline of Annual Report
Programs in the SED Teaching, Learning & Curriculum BSELED (Bachelor of Science in Elementary Education) Elementary Certification Secondary Certification BS with Secondary Certification MAT (Master of Arts in Teaching) MA EdS, EdD, PhD in Education Curriculum and Instruction (C&I) Programs in the SED
Programs (contd) Graduate Psychology and Counseling MS in Special Education Learning Disabilities MA in School Counseling MA in Community Counseling Programs (cont d)
Programs (contd) Graduate Psychology and Counseling MS in Special Education Learning Disabilities MA in School Counseling MA in Community Counseling MA in Clinical Mental Health Counseling EdS in School Psychology MA, EdD, PhD in Educational Psychology PhD in Counseling Psychology Programs (cont d)
Programs (contd) Leadership Educational Leadership (K-12): Graduate Certificate, MA, EdS, EdD, PhD Higher Education Administration: MA, EdS, EdD, PhD Leadership: Undergraduate Certificate, MA, EdS, EdD, PhD Programs (cont d)
2012 2012- -2013 Candidate Enrollments Program Biology Chemistry Communication English ESL Education, Elementary History Integrated Science Language Arts 2013 Candidate Enrollments Elementary . . . . . 60 . . 2 Secondary . . 1 11 6 . 1 2 .
2012 2012- -2013 Enrollments (cont d) Program French Spanish Math/Math Education Music Education Physics Political Science Religion Social Studies, Elementary Social Studies, Secondary Visual Arts Education 2013 Enrollments (cont d) Elementary Secondary . 8 8 15 1 . 3 . 2 6 . . . . . . . 1 . .
2012 2012- -2013 Enrollments (cont d) Program Curriculum & Instruction Educational Leadership* Higher Education Administration Leadership* Special Education-Learning Disabilities School Counseling School Psychology Educational Psychology Community Counseling (phasing out) Clinical Mental Health Counseling Counseling Psychology 2013 Enrollments (cont d) Certificates*, MA, MS, EdS, EdD, & PhD 55 35 13 113 15 11 17 27 1 27 29
2012 2012- -2013 Enrollments (cont d) 2013 Enrollments (cont d) Total Enrollment = 470
Report of Assessment Data Student Outcomes Program Quality Faculty Assessment Report of Assessment Data
Student Outcomes by Department Student Outcomes by Department Teaching, Learning & Curriculum (TLC) Graduate Psychology & Counseling (GPC) Leadership (LEAD)
Student Outcomes Teacher Education Course Assessments 20+ assessments (rubrics), lowest mean rating 4.17/5.00 Over 90% of all ratings at least 3/5 CAS course grades: 14 disciplines, 300+ students most ratings over 4.00 (mean) 2 disciplines under 4.00 biology (3.86) & math (3.87) In 7 disciplines, 100% of students rate at least 3/5 Student Outcomes TLC TLC
Student Outcomes Teacher Education (MTTC Scores) MTTC = Michigan Test of Teacher Education for Content Area Certification Reported in 3-year blocks (2009- 2012) Student Outcomes TLC TLC
MTTC Content Area, 2009 Program Biology Communication English ESL History Int Science, El Int Science, Sec Language Arts MTTC Content Area, 2009- -2012 A.U. N 3 2 11 7 3 2 3 11 2012 Mich. % Pass 504 26 2,042 516 1,631 1,345 298 2,765 A.U. % Pass Mich. N 85.1 53.8 88.1 91.7 87.2 69.6 88.3 78.0 81.8 90.9
MTTC Content Area, 2009 Program Biology Communication English ESL History Int Science, El Int Science, Sec Language Arts MTTC Content Area, 2009- -2012 A.U. N 3 2 11 7 3 2 3 11 2012 Mich. % Pass 504 26 2,042 516 1,631 1,345 298 2,765 A.U. % Pass Mich. N 85.1 53.8 88.1 91.7 87.2 69.6 88.3 78.0 81.8 90.9
MTTC Content Area, Program Math, Elem Math, Sec Music Physics Social Studies Spanish Elem Education All Tests MTTC Content Area, 2009 2009- -2012 (cont d) A.U. % Pass 1,610 1,118 2012 (cont d) Mich. N A.U. N Mich. % Pass 86.7 95.3 98.6 89.8 73.5 88.7 98.1 5 4 7 2 6 9 415 196 2,677 631 7,618 34,556 88.5 23 100.0 108 89.8
MTTC Content Area, Program Math, Elem Math, Sec Music Physics Social Studies Spanish Elem Education All Tests MTTC Content Area, 2009 2009- -2012 (cont d) A.U. % Pass 1,610 1,118 2012 (cont d) Mich. N A.U. N Mich. % Pass 86.7 95.3 98.6 89.8 73.5 88.7 98.1 5 4 7 2 6 9 415 196 2,677 631 7,618 34,556 88.5 23 100.0 108 89.8
MTTC Content Area, Program Math, Elem Math, Sec Music Physics Social Studies Spanish Elem Education All Tests MTTC Content Area, 2009 2009- -2012 (cont d) A.U. % Pass 1,610 1,118 2012 (cont d) Mich. N A.U. N Mich. % Pass 86.7 95.3 98.6 89.8 73.5 88.7 98.1 5 4 7 2 6 9 415 196 2,677 631 7,618 34,556 88.5 23 100.0 108 89.8
Student Outcomes Curriculum & Instruction In 9 assessment rubrics, lowest mean rating 4.77/5.00 100% of all ratings at least 3/5 Student Outcomes TLC TLC
Student Outcomes Assessment Data Across All GPC Programs In 14 assessment rubrics, lowest mean rating 3.54/5.00 For all assessments except 2, > 90% of all ratings at least 3/5 In 6 assessments, 100% at least 3/5 Student Outcomes GPC GPC
Student Outcomes Educational Leadership In 10 assessments, lowest mean rating 4.48/5.00 For all assessments, more than 90% of all ratings at least 3/5 Student Outcomes LEAD LEAD
Student Outcomes Leadership (Portfolio Assessments) Across 14 competencies, lowest mean rating 3.14/5.00 >98% of all ratings at least 3/5 Student Outcomes LEAD LEAD
Program Quality SED Overall Alumni Survey (2010-2011) N = 19 4.05/5.00 (mean) on 16 questions addressing program quality Program Quality Program Quality by Department Teaching, Learning & Curriculum Graduate Psychology & Counseling Leadership
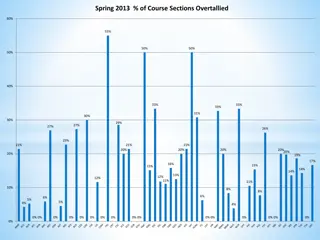
Program Quality Course Evaluations, Spring 2013 Question This course helped me to express my ideas more clearly. The learning objectives or goals for this course were clearly stated. The grading system of this course was appropriate for the objectives of the course. Program Quality TLC TLC % at 4-5 79.8 Mean 4.04 91.2 4.31 83.7 4.13 N = 158
Program Quality Course Evaluations, Spring 2013 (cont d) Question Methods of evaluation were fair and accurate measures of my learning. This course helped me to critically evaluate different sources and/or points of view. Independent of the instructor, my overall rating of this course is: Program Quality TLC TLC % at 4-5 82.4 Mean 4.14 75.3 4.07 64.6 N = 158 3.71
Program Quality Senior Exit Survey, Teacher Education (2012-2013) Program Quality TLC TLC Seniors (n = 14) rated program/faculty at least 3.75/5.00 (mean) on all indicators except one. 3.50 (mean) for There were adequate specialized equipment (e.g. computers, instruments, lab supplies, etc.). Similar to ratings across the University.
Program Quality Course Evaluations, Spring 2013 Question This course helped me to express my ideas more clearly. The learning objectives or goals for this course were clearly stated. The grading system of this course was appropriate for the objectives of the course. Program Quality GPC GPC % at 4-5 80.4 Mean 4.05 90.7 4.31 86.2 4.26 N = 173
Program Quality Course Evaluations, Spring 2013 (cont d) Question Methods of evaluation were fair and accurate measures of my learning. This course helped me to critically evaluate different sources and/or points of view. Independent of the instructor, my overall rating of this course is: Program Quality GPC GPC % at 4-5 83.2 Mean 4.13 86.7 4.28 63.7 N = 173 3.83
Program Quality Course Evaluations, Spring 2013 Question This course helped me to express my ideas more clearly. The learning objectives or goals for this course were clearly stated. The grading system of this course was appropriate for the objectives of the course. Program Quality LEAD LEAD % at 4-5 93.5 Mean 4.59 90.0 4.45 90.2 4.46 N = 110
Program Quality Course Evaluations, Spring 2013 (cont d) Question Methods of evaluation were fair and accurate measures of my learning. This course helped me to critically evaluate different sources and/or points of view. Independent of the instructor, my overall rating of this course is: Program Quality LEAD LEAD % at 4-5 91.0 Mean 4.47 99.1 4.72 85.7 N = 110 4.35
Faculty Assessment Course Evaluations Advisor Evaluations Senior Exit Survey Faculty Assessment
Faculty Assessment Course Evaluations N = 464 (all SED) 4.33/5.00 = mean rating on 9 questions related to the instructor Highest: The instructor was sensitive to and respectful of all people (4.49) Lowest: Timely, thoughtful, and helpful feedback was provided on tests and other work (4.16) Faculty Assessment
Faculty Assessment Advisor Evaluations Difficulty in collecting data Revised process to begin March 2014 2012-2013: Only Leadership data N = 25 All LEAD advisors 4.50/5.00 (mean) on 10 of 14 indicators Lowest: My advisor responds within two business days to my e-mail and/or telephone messages (4.15) Highest: My advisor is courteous and respectful (4.92) Faculty Assessment
Faculty Assessment Senior Exit Survey Teacher Education (undergrads only) N = 14 4.50 (mean) on6 of 7 faculty-related indicators Lowest: 4.00 for Faculty used technology effectively to enhance their teaching (cf. 4.10 across all Andrews seniors) Not so bad! Faculty Assessment
Faculty Assessment Senior Exit Survey (cont d) Lowest: 4.00 for Faculty used technology effectively to enhance their teaching (cf. 4.10 across all Andrews seniors) Not so bad! Highest: 4.86 for 2 indicators Faculty members showed genuine interest in each student Faculty taught me how Christian faith and ethics relate to my field Faculty Assessment
Dinner Time Dinner Time
Teacher Education Graduates 2011-2012 Roger Alva Science Rachel Ballast Katherine Bass Science Anabel Dominguez Justin Groff Erin Hotelling Jarrod Lutz Katherine Miller Science Teacher Education Graduates Jefferson Christian Acad Grand Rapids Adv Acad Integrated Spanish Integrated Math, Spanish Elementary Ed English English Integrated SDA School, California Spring Valley Acad Spencerville Adv Acad New Zealand
Teacher Education Graduates 2011-2012 (cont d) Cheri Notice Leah Rodriguez Debra Rosengren Nolan Williams Teacher Education Graduates (cont d) Social Studies, Sec English, Spanish Music Education Religion Milwaukee SDA Acad Graduate School Highland Advent Acad
Teacher Education Graduates 2012-2013 Teacher Education Graduates (cont d) Michelle Adame Jessica Catron Meredith Chavez Tanya Crumley Hannah DeLuca Geneva Fraser Tom Gammon Kimberly Geach Elizabeth Glover Holbrook SDA Ind Sch English English Social Studies Read, Soc St Language Arts Hinsdale Adventist Acad Language Arts Columbus Advent Acad Language Arts Columbus Advent Acad Language Arts Korea, student miss tchr Springs Adventist Acad Social Studies
Teacher Education Graduates 2012-2013 (cont d) Ben Hotelling Alicia Hutchinson Erica Johnson Ray Kirk Pat Leja Jeremy McIntyre Ashley Meyer Kalicia Morrison John Musselman Teacher Education Graduates (cont d) Kettering College Korea, student miss tchr Social Studies Math Language Arts Music Education English Music Education Elem School, Kalamazoo English Language Arts Math Charlotte Adventist Sch Bridgman High School
Teacher Education Teacher Education Graduates 2012-2013 (cont d) Brad Paquette Graduates (cont d) Political Science Niles New Tech Entre- preneurial Academy Social Studies Jessica Ramirez Visual Arts Educ Korea, student miss tchr Nicholas Reichert Jason Park English, Spanish Arizona Conference, asst to Youth Director History, English Warren Junior Academy Math, Physics Tonya Mae Ross Language Arts Michael Riess Styves Romain Central Penn Christian School, PA Lauren Snell Maxine Umana Language Arts Religion, Sec
MTTC Score Trends MTTC Score Trends Michigan Test of Teacher Certification for subject areas Reported in 3-year blocks 2006-2009 is missing 6-Year Trends by Subject/Program
MTTC Score Trends MTTC Score Trends All Tests (excluding Basic Skills) Years 09-12 08-11 07-10 06-09 05-08 04-07 N % Pass 89.8 86.7 91.6 - 93.1 91.3 108 105 131 - 189 184
MTTC Score Trends MTTC Score Trends Elementary Education Years 09-12 08-11 07-10 06-09 05-08 04-07 N 23 23 34 - 57 60 % Pass 100.0 95.7 97.1 - 98.2 98.3
MTTC Score Trends MTTC Score Trends English N 11 7 10 - 8 4 Years 09-12 08-11 07-10 06-09 05-08 04-07 % Pass 81.8 * 90.0 - * *
MTTC Score Trends MTTC Score Trends English as a Second Language Years 09-12 08-11 07-10 06-09 05-08 04-07 N 7 4 1 - 0 0 % Pass * * * - - -
MTTC Score Trends MTTC Score Trends Language Arts N 11 11 15 - 29 26 Years 09-12 08-11 07-10 06-09 05-08 04-07 % Pass 90.9 100.0 100.0 - 89.7 88.5
MTTC Score Trends MTTC Score Trends History N 3 4 8 - 11 10 Years 09-12 08-11 07-10 06-09 05-08 04-07 % Pass * * * - 100.0 90.0
MTTC Score Trends MTTC Score Trends Political Science N 0 0 0 - 1 1 Years 09-12 08-11 07-10 06-09 05-08 04-07 % Pass - - - - * *


")
")
")