APD Simulations Using Silvaco: Summary and Findings
Analysis and findings from APD simulations using Silvaco by Ranjeet Dalal of Delhi University, focusing on thickness, junction depth, gain curve trends, irradiation effects, doping profile, and impact of bulk doping and APD thickness on device performance during 9-2-16. Details include comparison with measurements, optimization steps taken, and implications for future simulations.

Download Presentation

Please find below an Image/Link to download the presentation.
The content on the website is provided AS IS for your information and personal use only. It may not be sold, licensed, or shared on other websites without obtaining consent from the author.If you encounter any issues during the download, it is possible that the publisher has removed the file from their server.
You are allowed to download the files provided on this website for personal or commercial use, subject to the condition that they are used lawfully. All files are the property of their respective owners.
The content on the website is provided AS IS for your information and personal use only. It may not be sold, licensed, or shared on other websites without obtaining consent from the author.
E N D
Presentation Transcript
APD simulations using Silvaco Ranjeet Dalal (Delhi Uni.) 9-2-16
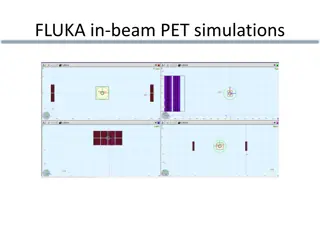
APD simulations summary - 130 micron APD thickness was used for simulations - Initially, junction depth 57 micron was used for simulations - Gain curve trends were similar to the measurements (for infrared) - There was no signal for junction depth 57 micron using 480nm as reported in publication Hence, Reduced junction depth to about 37 micron -The simulated gain curve was higher than measurement - Significant irradiation effect observed - More simulations for understanding the device
Gain Comparison with measurement (with 37 micron junction depth on 13-1-2016)
Doping Profile 0.004 14.001 25.898 39.895 54.943 70.695 86.444 101.495 111.643 120.046 128.097 135.451 141.061 145.096 151.238 153.748 155.465 156.186 156.857 158.987 9.10E+16 5.57E+16 3.68E+16 2.21E+16 1.23E+16 5.80E+15 3.12E+15 1.55E+15 1.08E+15 6.89E+14 4.72E+14 3.00E+14 1.70E+14 1.23E+14 4.53E+13 2.82E+13 1.57E+13 7.47E+12 2.84E+12 6.55E+12 - Doping profile provided by Sebastian - 100 micron is assumed to be removed - Junction at about 57 micron - It was wrong to assume APD thickness equal to 130 micron - Bulk doping may be slightly different from measurements (measurement errors!) - For 57 micron junction depth - Initial bulk doping of 1.55e15 is used For junction depth equal to 52 micron - Initial bulk doping of 1.30e15 is used
Effect of bulk doping (APD thickness -130 micron) - Peak E field (around junction) is reduced for lower bulk doping - Charge multiplication is significantly affected by bulk doping variation
Effect of APD thickness - In 300 micron thick APD, Electric field is extended beyond 130 micron - Results in lower field for multiplication region - Charge multiplication is much lower for 300 micron APD compared to 130 micron case It was wrong to work with 130 micron APD ! All the subsequent simulations are done with 300 micron APD with bulk Doping equal to 1.3e14cm-3
Junction depth effect on 670 nm TCT -670 nm TCT signal can be divided in two components - Initial fast Drift component - Slow diffusion component -Reducing junction depth increases the drift part significantly
TCT signal for 670 and 980nm for junction depth 57 micron -TCT signal for 980 nm laser is having, mainly, drift component - TCT signal for 670nm laser is having mainly, diffusion component - Log scale -Drift and diffusion components are visible in C. Lu results too (27th Jan meeting)
TCT signal for 670 and 980nm for junction depth 57 and 52 microns -57 micron junction is looking good -Diffusion component is larger than drift on similar to measurements (C. Lu) -Log scale
Suggestions needed for further work! - Thanks for your attention!


")