Benefit-Cost Analysis Combined with AHP for Connected Vehicle Technology
This study explores the integration of Benefit-Cost Analysis with Analytical Hierarchy Process to support investments in Intelligent Transportation Systems (ITS) with a focus on Connected Vehicle Technology. The research evaluates data quality and quantity implications, decision-making processes, and the impact of emerging technologies on traffic operations and transportation planning. Key areas include communication modes, technologies, and messages related to Connected Vehicle Technology.
Download Presentation

Please find below an Image/Link to download the presentation.
The content on the website is provided AS IS for your information and personal use only. It may not be sold, licensed, or shared on other websites without obtaining consent from the author.If you encounter any issues during the download, it is possible that the publisher has removed the file from their server.
You are allowed to download the files provided on this website for personal or commercial use, subject to the condition that they are used lawfully. All files are the property of their respective owners.
The content on the website is provided AS IS for your information and personal use only. It may not be sold, licensed, or shared on other websites without obtaining consent from the author.
E N D
Presentation Transcript
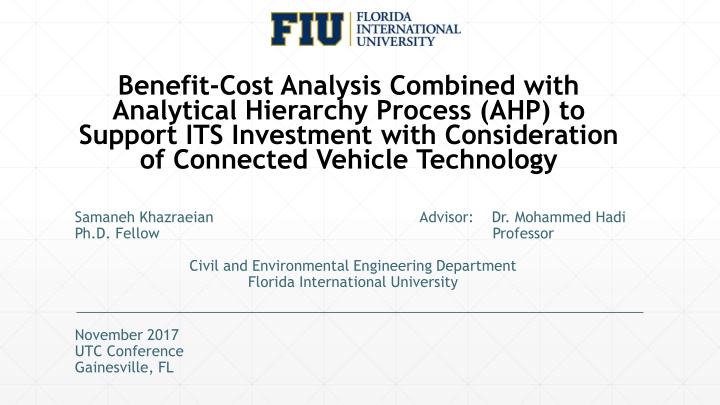
Benefit-Cost Analysis Combined with Analytical Hierarchy Process (AHP) to Support ITS Investment with Consideration of Connected Vehicle Technology Samaneh Khazraeian Ph.D. Fellow Professor Advisor: Dr. Mohammed Hadi Civil and Environmental Engineering Department Florida International University November 2017 UTC Conference Gainesville, FL
Presentation Outline Introduction Literature Review Data & Methodology Analysis Results Conclusions 2
Methodology Results Conclusions Literature Introduction Connected Vehicle Technology Communication Modes: V2V: Vehicle to Vehicle Communication V2I: Vehicle to Infrastructure Communication Communication Technologies: Dedicated Short Range Communication (DSRC) Non-DSRC: Cellular, Wi-Fi 4
Methodology Results Conclusions Literature Introduction Connected Vehicle Technology Connected Vehicle Messages and Communication Modes based on The Society of Automotive Engineers (SAE) J2735: BSM I: Vehicle position Heading Speed Acceleration Vehicle size V2V V2I I2V Basic Safety Message Part 1 Basic Safety Message Part 2 Emergency Vehicle Alert Common Safety Request Probe Data Messages Signal Request Message Roadside Alert Traveler Information MAP Data BSM II: Air temperature Wiper status Light status Road coefficient of friction Vehicle type Brake system activation 5
Methodology Results Conclusions Literature Introduction Problem Statement Emerging Connected Vehicle Technology Will affect: Data quality and quantity to support real time traffic operation and off-line transportation planning Decisions to invest in alternative ITS technologies Based on the National CV Field Infrastructure Footprint Analysis : Public agencies will need to assess the use of connected vehicle probe data versus existing methods of data collection when making investment decisions 6
Methodology Results Conclusions Literature Introduction Motivation of Study Currently, the available sources of data for TMCs to determine the state of managed systems: Traffic sensors Cameras Automatic vehicle re-identification technologies (such as Bluetooth and Wi-Fi readers) Data collected from third-party feeds from HERE, INRIX, and WAZE. Connected vehicle data : A potential alternative for collecting data Develop a multi-criteria decision-making framework that support agencies in their decisions to invest in ITS technologies, with consideration of different criteria, as well as the uncertainties involved in the decision-making process 7
Methodology Results Conclusions Introduction Literature Multi-Criteria Decision Analysis (MCDA) MCDA: Finding a compromise solution among different alternatives considering multiple objectives (criteria) MCDA Methods: Simple Additive Weighting (SAW) Analytic Hierarchy Process (AHP) Most widely used MCDA method in the transportation field Technique for Order Preference Similarity to Ideal Solution (TOPSIS) Fuzzy TOPSIS 9
Methodology Results Conclusions Introduction Literature MCDA Methods Basis Three main steps: Assigning a weight to each evaluation criterion based on decision makers pairwise comparisons of the criteria Assigning a score to each alternative based on the decision maker s pairwise comparison of the alternatives for each criterion. The higher the score, the better the alternative with respect to the corresponding criterion. Combining the criteria weights and alternative scores and generating a global score for each alternative. 10
Introduction Literature Results Conclusions Methodology Methodology Summary Traffic Data and Tools Simulated Connected Vehicle Applications Automatic Incident/Bottleneck Detection Travel Time Estimation Existing (Legacy) Data Emerging (CV) Data Existing (Legacy) Data Emerging (CV) Data Multi-Criteria Decision Analysis Alternative Selection 12
Introduction Literature Results Conclusions Methodology Data-VISSIM VISSIM micro-simulation: To simulate the traffic under normal and incident conditions Network: 15 mile segment of the I-95 southbound (SB) corridor in Broward County, Florida VISSIM COM interface To model drivers behavior under incident condition 13
Introduction Literature Results Conclusions Methodology Data-Trajectory Conversion Algorithm (TCA) Simulate the connected vehicles messages via DSRC technologies or cellular communications Basic Safety Messages (BSM) Probe Data Messages (PDMs) European Cooperative Awareness Messages (CAM) Input: Vehicle Trajectories (VISSIM fzp file or csv file) Output: Connected Vehicle Messages(csv file) 14
Introduction Literature Results Conclusions Methodology TCA-Inputs & Outputs Input-VISSIM Trajectory Passing through TCA Output-BSM file 15
Introduction Literature Results Conclusions Methodology Proposed Bottleneck/Incident Detection Method Speed-Difference Method The network is decomposed to m segments Average speed of each segment is calculated at each time step If the difference between downstream average speed and upstream average speed is more than a threshold Bottleneck Threshold: The 99 percentile of speed difference distribution under the no-incident condition 16
Introduction Literature Results Conclusions Methodology Speed-Difference Method Flowchart Generate VISSIM Trajectory Under incident condition Emulate CV Data Running TCA and generating CV data which are input for the incident detection algorithm Generate VISSIM Trajectory Under no-incident condition Apply Detection Algorithm Running the detection algorithm and determining the incident location and time using MATLAB Calculate Detection Threshold Using MATLAB to determine threshold 17
Introduction Literature Results Conclusions Methodology Proposed Multi-Criteria Decision Analysis (MCDA) Method A combination of a stochastic return on investment and an MCDA method referred to as the Analytical Hierarchy Process (AHP) Monteizable: Assessed in the stochastic NPV analysis using Monte Carlo Simulation Measures Non-monetizable: Assessed in the AHP analysis Applied to an ITS investment case study of traffic monitoring and data collection service which includes: Incident detection, and Travel time estimation 18
Introduction Literature Results Conclusions Methodology Criteria for Alternative Selection Goal Objectives Sub-Criteria Alternatives 1.1- Ability to measure travel time 1.2- Ability to measure volume and/or density 1-Provision of the required functions 1.3- Ability to measure new measures (acceleration noise, stops, breaks, wiper on/off, light on/off, emission, potential for crashes etc.) 2.1-Mean absolute error in measurement 2.2-Stdandard deviation of error of measurement 2-3 Detection timeliness 3.1-Technology uncertainty 3.2-Standard stability 3.3-Uncertainty in business model 3.4-Data archiving and processing and technical skill concerns 3.5-Funding (initial and recurring) 3.6-Data availability and sharing concern 3.7-Security and privacy concerns 4.1-Median present worth (based on Monte Carlo analysis) 4.2- 15% present worth (based on Monte Carlo analysis) Alternative 1: Point detectors 2-Achieving the required performance Selecting between CV and existing detection technologies for traffic monitoring and data collection service Alternative 2: Connected vehicles 3-Minimizing the risks and constraints 4-Maximizing the return on investment based on NPV 19
Introduction Literature Results Conclusions Methodology Proposed Multi-Criteria Decision Analysis (MCDA) Method Freeway Traffic Monitoring & Data Collection Benefits CV Benefits Point Detector Benefit Costs CV Deployment Costs Point Detector Costs Monte Carlo Simulation Expressing the uncertain variables as distributions rather than point estimates NPV Distribution Alternative Selection AHP Analysis Criteria ratings by decision makers 20
Introduction Literature Results Conclusions Methodology Benefits of Traffic Monitoring Technology Alternatives The incremental benefits of traffic monitoring and data collection technology alternatives are assumed to result from: Faster incident/bottleneck detection that results in lower delays More accurate travel time estimation that results in better diversion decisions 21
Introduction Literature Results Conclusions Methodology Benefits of Traffic Monitoring Technology Alternatives Incident/bottleneck detection benefits: ???????? ????????? ????????= (?????? ?????????????) ??? ??? where, ??????= total delay of the base alternative in veh-hr, ????????????? = total delay of the alternative in veh-hr, VOT = value of time in dollars, and ??? = total number of incidents for the ith year. 22
Introduction Literature Results Conclusions Methodology Incident/bottleneck Detection Benefits Delay calculation based on queuing theory: Reduction in the incident duration due to the reduction in the detection time resulting from applying the alternative detection technology ?? ?? (? ??) 2 ?? = Total Delay (veh-hrs) ?? (? ??) (? ?) tQ : where, ?= arrival rate (demand) (vph), ?= arrival rate (demand) (vph), ??= reduced capacity rate under under non-recurrent conditions for the mainline (vph), ??= Event duration (hr), and ??= Time in queue duration (hr). 23
Introduction Literature Results Conclusions Methodology Incident/bottleneck Detection Benefits Incident detection time based on CV data: Incident detection time based on point detector data: ??????= ?(??,? ????????????= ?(?,? ?) ?) where, ????????????= mean time to detect using detector data (min), and D = distance between the closest upstream point detector to the incident location (ft) where, ??????= mean time to detect using CV data (min), MP = CV market penetration (%), V = volume in vehicle per hour, and C = capacity in vehicle per hour. 24
Introduction Literature Results Conclusions Methodology Benefits of Traffic Monitoring Technology Alternatives Travel time accuracy benefits: 2 ??= 1.2 0.003918 ????? ?? ???????? ????????= ?? ??? ?? ??? ??? where, ?? ???????? ???????? = ith year travel time accuracy benefit, ??= ith year monetary value of travel time accuracy per trip ($), SPDEi = ith year travel time standard deviation of percentage error, ??? = ith year queue duration calculated using the queuing ?? = ith year travel demand, ??? = ith year incident frequency, and ???= ith year diversion rate. 25
Introduction Literature Results Conclusions Methodology Benefits of Traffic Monitoring Technology Alternatives SPDE of Travel time estimated based on: CV data: ???? = ?(??,? ?) where, ???? = standard deviation of percentage error, V = volume (vph), C = capacity (vph), and MP = CV proportion (%). Point detector data A random value between 10% and 20% based on a previous studies 26
Introduction Literature Results Conclusions Methodology Costs of Traffic Monitoring Technology Alternatives CV deployment costs Extracted from The Life Cycle Cost Model (LCCM) developed by the Federal Highway Administration (FHWA) Total cost of CV deployment for a 15-mile corridor: $609,100 Point detector costs Based on the Florida Department of Transportation s (FDOT) District 6 cost database Cost: capital, replacement, calibration, maintenance, design, and mobilization costs Total cost for a 15-mile corridor: $665,200 27
Introduction Literature Methodology Conclusions Results Incident/Bottleneck Detection Results Mean time to detect (MTTD) based on point detector data ????????????= 4.375 (6.427 ? ?) + (0.003 ?) where, ????????????= mean time to detect using detector data (min), D = distance between the closest upstream point detector to the incident location (ft), V = volume in vehicle per hour, and C = capacity in vehicle per hour. 29
Introduction Literature Methodology Conclusions Results Incident/Bottleneck Detection Results Derived equations for CV-based MMTD: Mean Time to Detect (MTTD) (80%) 75 . 0 6 % MP = MTTD Equation + ( / )* v c MP 51 649 . 54 563 . * 6 % e MP Statistic R-squared: 0.798 Mean Time to Detect (MTTD) (95%) . 0 75 6 % MP = MTTD Equation + ( / * ) c v MP 102 892 . 108 192 . * 6 % e MP Statistic R-squared: 0.665 30
Introduction Literature Methodology Conclusions Results MCDA Application Results Case study: An investment decision for a 15-mile segment of a freeway corridor in Miami, Florida Two volume demand levels: moderate and light traffic (V/C ratio=0.8 and V/C ratio=0.4) Monte Carlo analysis results: NPV Distributions AHP Analysis 31
Introduction Literature Methodology Conclusions Results AHP Application Results: Decision Objectives Pairwise Comparison by the Decision Makers Provision of the required functions Achieving the required performance Minimizing the risks and constraints Maximizing the return on investment Decision Maker Objectives Provision of the required functions Achieving the required performance Minimizing the risk and constraints Maximizing the return on investment Provision of the required functions Achieving the required performance Minimizing the risks and constraints Maximizing the return on investment 1 1 2 2 1 1 2 2 Decision Maker 1 0.5 0.5 1 2 0.5 0.5 0.5 1 1 1 0.5 0.5 1 1 0.5 0.5 Decision Maker 2 2 2 1 1 2 2 1 1 32
Introduction Literature Methodology Conclusions Results AHP Application Results: Alternative Scores Based on Decision Maker 1 Ratings CV deployment start from year 1 Provision of the Achieving the required Minimizing the risks and Maximizing the return on Final Score required functions performance constraints investment based on NPV CV 0.58 0.66 0.21 0.84 0.56 V/C=0.8 Point Detector 0.42 0.34 0.79 0.16 0.44 CV 0.58 0.64 0.21 0.54 0.52 V/C=0.4 Point Detector 0.42 0.36 0.79 0.46 0.48 CV deployment start from year 5 CV 0.58 0.76 0.34 0.74 0.60 V/C=0.8 Point Detector 0.42 0.24 0.66 0.26 0.40 CV 0.58 0.71 0.34 0.45 0.55 V/C=0.4 33 Point Detector 0.42 0.29 0.66 0.55 0.45
Introduction Literature Methodology Conclusions Results AHP Application Results: Alternative Scores Based on Decision Maker 2 Ratings CV deployment start from year 1 Provision of the Achieving the required Minimizing the risks and Maximizing the return on Final Score required functions performance constraints investment based on NPV CV 0.58 0.60 0.23 0.85 0.56 V/C=0.8 Point Detector 0.42 0.40 0.86 0.15 0.47 CV 0.58 0.55 0.23 0.54 0.45 V/C=0.4 Point Detector 0.42 0.45 0.86 0.46 0.58 CV deployment start from year 5 CV 0.58 0.73 0.37 0.75 0.59 V/C=0.8 Point Detector 0.42 0.27 0.72 0.25 0.44 CV 0.58 0.64 0.37 0.45 0.48 V/C=0.4 Point Detector 0.42 0.36 0.72 0.55 0.55 34
Introduction Literature Methodology Results Conclusions Conclusions Demonstrated the need for developing a framework to support agencies in ITS investment decisions considering the emerging technologies Assessed the performance of alternative technologies using the developed evaluation methods 36
Introduction Literature Methodology Results Conclusions Conclusions MCDA Application Stochastic return on investment Utilizing CV data for freeway segments is significantly more cost-effective than using point detectors in detecting incidents and providing travel time estimates one year after CV technology becomes mandatory for all new vehicles, and for corridors with moderate to heavy traffic For corridors with light traffic (V/C=0.4), there is a probability of CV deployment not being effective in the first few years due to low measurement reliability of travel times and high latency of incident detection, associated with smaller sample sizes of the collected data AHP analysis Scores of the evaluated alternatives vary depending on stakeholder priorities When the provision of the required function and achieving the required performance are more important than minimizing the risk for an agency, the CV-based alternative has a higher score than when minimizing the risk has a higher weight in the MCDA 37
Introduction Literature Results Conclusions Methodology AHP Method Step 1: Calculating the vector of criteria weights m criteria, n alternatives Creating pairwise comparison matrix A (m*m) Each element aij: Importance of ith criterion relative to the jth criterion Relative importance between the two criteria : numerical scale ranging from 1 to 9 Normalizing the comparison matrix A and creating matrix Anorm with the following elements: ??? ?=1 where, ??? = elements of the normalized pairwise matrix (Anorm) indicating the importance of ith criterion relative to the jth criterion, and ??? = elements of the pairwise comparison matrix A. ???= ???? 39
Introduction Literature Results Conclusions Methodology AHP Method Cont d Step 1: Calculating the vector of criteria weights Calculating each criterion weight: Averaging the elements on each row of the normalized matrix ? ?=1 ??? ??= ? where, ??= criterion j weight, and m=pairwise comparison matrix dimension (number of criteria). 40
Introduction Literature Results Conclusions Methodology AHP Method Step 2: Calculating matrix of alternative scores (matrix size: n*m) Creating a pairwise matrix B(i) for each of the m criterion (matrix size : n*n) ? of the matrix B(i) : Importance of the kth alternative, compared to the Each element ?? hth alternative, with respect to the ith criterion Score vectors s(i): devising each element of the matrix by the sum of entries in the same column, and then averaging each row s(i) is a vector composed of different alternative scores with respect to the ith criterion ? = [?1 ?(?)] Score matrix S 41
Introduction Literature Results Conclusions Methodology AHP Method Step 3: Calculating each alternative scores and ranking them ? = ?.? where, ? = global score for each alternative, ? = score matrix, and ? = criteria weight vector. The ith element of v: global score for alternative i Ordering the global scores in a descending order 42
Introduction Literature Methodology Conclusions Results Monte Carlo Simulation Results : Alternatives Performance Measures 50th Percentile (Median) Results Year 1 Year 3 Year 5 Year 7 Year 9 CV-based 10.76 8.38 7.05 6.02 5.12 SPDE (%) Point Detector 15.14 15.14 15.14 15.14 15.14 CV-based 2.20 0.75 0.75 0.75 0.75 MTTD (min) Point Detector 5.03 4.96 4.90 4.84 4.76 85th Percentile Results V/C=0.4 Year 1 Year 3 Year 5 Year 7 Year 9 CV-based 11.59 8.92 7.48 6.40 5.48 SPDE (%) Point Detector 18.48 18.48 18.48 18.48 18.48 CV-based 2.57 0.75 0.75 0.75 0.75 MTTD (min) Point Detector 7.70 7.66 7.61 7.50 7.47 43
Introduction Literature Methodology Conclusions Results Monte Carlo Simulation Results : Alternatives Performance Measures 50th Percentile (Median) Results Year 1 Year 3 Year 5 Year 7 Year 9 CV-based 10.23 7.81 6.44 5.44 4.51 SPDE (%) Point Detector 14.91 14.91 14.91 14.91 14.91 CV-based 1.66 0.75 0.75 0.75 0.75 MTTD (min) Point Detector 2.94 2.81 2.72 2.61 2.54 85th Percentile Results V/C=0.8 Year 1 Year 3 Year 5 Year 7 Year 9 CV-based 11.02 8.34 6.89 5.84 4.91 SPDE (%) Point Detector 18.30 18.30 18.30 18.30 18.30 CV-based 2.24 0.75 0.75 0.75 0.75 MTTD (min) Point Detector 5.83 5.70 5.62 5.54 5.42 44
Introduction Literature Methodology Conclusions Results Monte Carlo Simulation Results : NPV Distributions V/C=0.8 V/C=0.4 45
Introduction Literature Methodology Conclusions Results Incident/Bottleneck Detection Results MTTD based on CV data using Monte Carlo simulation The investigated v/c ratios: 0.36, 0.5, 0.72, 0.86 CV proportions: 1, 3, 6, 9 and 15 percent V/C MP*(%) No. of Runs SD** Median (min) 80% (min) 90%(min) 95%(min) 1 130 1.56 2.25 3 4.5 5.25 3 30 0.68 1.5 1.5 2.25 3 0.43 6 30 0.42 0.75 1.5 1.5 1.5 9 20 0.43 0.75 1.5 1.5 1.5 15 10 0.32 0.75 0.75 1.5 1.5 *MP: Market Penetration **SD: Standard Deviation 46
