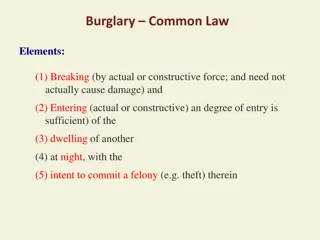
Burglary Offences and Elements
Burglary offences are outlined in the Theft Act 1968, with different types such as aggravated burglary. The actus reus of burglary involves entry as a trespasser into a building or part of a building. The intent to commit an offense varies between s.9(1)(a) and s.9(1)(b), with specific elements required for each. Court interpretations of entry have evolved through case law, shaping the understanding of burglary.

Download Presentation

Please find below an Image/Link to download the presentation.
The content on the website is provided AS IS for your information and personal use only. It may not be sold, licensed, or shared on other websites without obtaining consent from the author.If you encounter any issues during the download, it is possible that the publisher has removed the file from their server.
You are allowed to download the files provided on this website for personal or commercial use, subject to the condition that they are used lawfully. All files are the property of their respective owners.
The content on the website is provided AS IS for your information and personal use only. It may not be sold, licensed, or shared on other websites without obtaining consent from the author.
E N D
Presentation Transcript
Comparison of Activity-Based Model Parameters Between Two Cities presented to 14TH TRB National Transportation Planning Applications Conference presented by Cambridge Systematics, Inc. Thomas Rossi Jason Lemp Anurag Komaduri Jonathan Ehrlich, Metropolitan Council May 7, 2013 Transportation leadership you can trust.
What This Presentation Is Not A transferability study But it does provide some information relevant to people considering transferring activity-based models 2
Houston and Twin Cities Activity-Based Models Synthetic Population Generator Highway and Transit Networks Land Use and Demographic Data Activity-Based Model Components Other Models (Truck, External, Airport) Highway and Transit Assignment 3
Houston/Twin Cities Model System Flow Long-Term Choices Auto Ownership, Work Location, etc. Tour Generation Individual School Escorting Model Daily Activity Pattern (including Work/School Travel) Nonmandatory Travel Fully Joint Travel Tour-Level Choices Individual Nonmandatory Tour Destination & Time of Day Joint Tour Destination & Time of Day Mandatory Tour Destination & Time of Day All Tour Stop Generation & Mode Choice Stop/Trip-Level Choices Stop (Trip) Level Destination, Time of Day, and Mode Choice 4
Houston and Twin Cities Model Similarities Same basic structure Implemented in TourCast and Cube Estimated from local household survey data Tour purposes: Work School University Shop Meal Personal Business Social/Recreation Escort 5
Houston and Twin Cities Model Structure Differences Additional long term model components in Twin Cities model (transit path ownership, MnPass ownership) Synthetic population generator Houston Based on UrbanSim Twin Cities PopGen Differences in exogenous travel models (external, truck, special generator) 6
A Tale of Three Cities (Two of Which Are Twins) Houston 6,051,850 2,145,146 160M (2010) Twin Cities 3,389,049 387,753 / 288,448 66.5M (2005) Metro area population (2011) Central city population (2011) Estimated VMT Public transit passengers (2012) Bike tour mode share Avg. temperature - Jan. (F) Avg. temperature - July (F) Avg. annual snowfall (inches) 77.6M 0.6% 63 / 43 94 / 75 0.1 81.1M 1.3% 24 / 8 83 / 64 54 7
Houston/Twin Cities Model System Flow Long-Term Choices Auto Ownership, Work Location, etc. Tour Generation Individual School Escorting Model Daily Activity Pattern (including Work/School Travel) Nonmandatory Travel Fully Joint Travel Tour-Level Choices Individual Nonmandatory Tour Destination & Time of Day Joint Tour Destination & Time of Day Mandatory Tour Destination & Time of Day All Tour Stop Generation & Mode Choice Stop/Trip-Level Choices Stop (Trip) Level Destination, Time of Day, and Mode Choice 8
Tour Mode Choice Model Tour Purpose Segmentation Individual work Individual school/university Individual non-mandatory (excluding escort purpose) Individual escort Individual work-based subtours Joint non-mandatory tours 9
Tour Mode Choice Model Tour Purpose Segmentation Individual work 10
Mode Alternatives/Nesting Structure Root Drive Alone Shared Ride 2 Shared Ride 3 Non- Transit Motorized Drive Transit Walk Transit Walk Bike 11
Work Tour Mode Choice Model Variables Level of Service Total travel cost (segmented by income level) In-vehicle time Out-of-vehicle time (walk access/egress, wait, transfer, auto terminal time) Travel distance (non-motorized) 12
Work Tour Mode Choice Model Variables Land Use/Demographic Mixed use density Number of vehicles Total employment density Cars relative to workers/adults Retail density Age level Population density Gender Income Worker status Household size Student status 13
Work Tour Mode Choice Model Variables Activity Pattern Presence of stops on half tour Number of tours by purpose Number of stops by purpose (on tour or half tour) Whether the tour involves school escorting Arrival and return time periods 14
Work Tour Mode Choice Model Estimated Model Parameters Level of Service/Land Use Houston -0.0102 -0.123 to -0.0312 -0.0777 -1.18 Twin Cities -0.0116 -0.196 to -0.0513 -0.202 -0.745 Generalized Time (min) Cost ($, by income level) Bike distance (miles) Walk distance (miles) Mixed Use Density (work) (TA) Retail Density (work) (TA) Population Density (work) (DA) Employment Density (home) (walk) Employment Density (work) (walk) -0.493 0.025 -0.0017 0.0535 0.0082 0.16 0.033 0.0028 0.31 0.092 15
Work Tour Mode Choice Model Estimated Model Parameters Person/Household Houston 0.3587 -1.31 12.2 2.92 2.35 -1.47 0.233 0.203 4.99 -1.48 -0.719 -2.38 1.43 Twin Cities -1.59 -3.30 0.658 n/a 1.38 -1.31 -1.43 n/a -2.03 -2.88 0.185 -2.49 0.84 Workers > Cars (TA) Income < $40K (TA) Zero Cars (TW) Workers > Cars, Cars > 0 (TW) Adults > Cars, Workers < Cars, Cars > 0 (TW) 2-Person HH (SR3) 2-Person HH (SR2) Workers Zero Cars (SR) 1 person household (SR) 3+ person household (DA) Workers > Cars, Cars > 0 (TW) Age < 30 (bike) 16
Work Tour Mode Choice Model Estimated Model Parameters Person/Household Houston 0.620 1.34 0.651 1.35 -0.614 -2.00 Twin Cities 0.299 0.17 0.251 0.167 -0.611 -1.12 Arrive 7-9 a.m. (TA) Depart 4-6 p.m. (TA) Presence of stops (TA) Presence of stops (TW) Number of tours (TA, TW) Presence of stops (walk) # of Meal Stops half tour 1 (SR3) # of Escort Stops half tour 1 (SR3) # of Escort Stops half tour 1 (SR2) Number of Work Stops (SR) Number of Work Stops (DA) 2.09 3.68 1.96 1.30 0.937 n/a n/a n/a n/a n/a 17
What Does It Mean? Some similarities, some differences Are some differences due to differences between the cities? Probably (demographics, bike shares) Would we get different results if we applied the Houston model to the Twin Cities? Seems likely, but calibration could change results Is more research into transferability needed? Sure! 18