California State Plan for Career and Technical Education Overview
The California State Plan for Career and Technical Education (CTE) focuses on preparing students for the evolving job market by addressing key drivers such as strategic planning, equity, and innovation. It emphasizes engaging stakeholders, aligning efforts, and ensuring access to quality education and training. The plan includes cross-cutting themes and priorities to enhance career pathways, support workforce development, and promote effective delivery of CTE programs.
Download Presentation

Please find below an Image/Link to download the presentation.
The content on the website is provided AS IS for your information and personal use only. It may not be sold, licensed, or shared on other websites without obtaining consent from the author. If you encounter any issues during the download, it is possible that the publisher has removed the file from their server.
You are allowed to download the files provided on this website for personal or commercial use, subject to the condition that they are used lawfully. All files are the property of their respective owners.
The content on the website is provided AS IS for your information and personal use only. It may not be sold, licensed, or shared on other websites without obtaining consent from the author.
E N D
Presentation Transcript
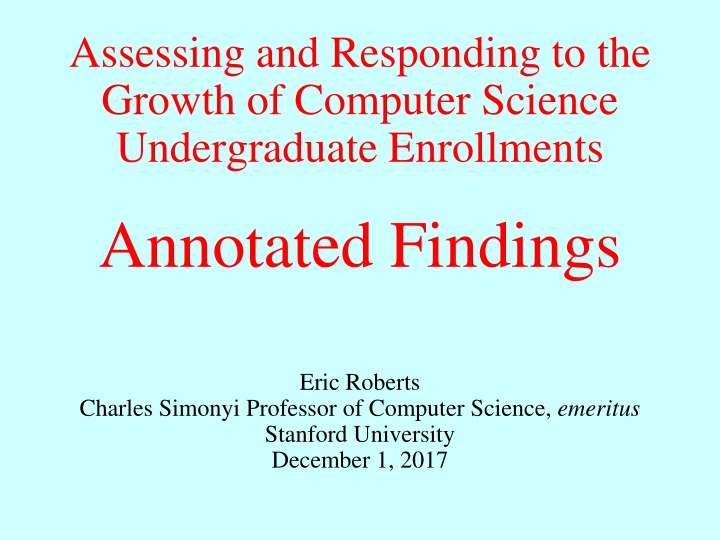
Assessing and Responding to the Growth of Computer Science Undergraduate Enrollments Annotated Findings Eric Roberts Charles Simonyi Professor of Computer Science, emeritus Stanford University December 1, 2017
The National Academies Report On October 26, 2017, the National Academies released its report (in prepublication form) on the growing enrollments in computer science and the challenges that universities and colleges face in responding to the demand. This presentation reproduces these findings along with additional slides outlining the supporting evidence.
Finding 1 National bachelor s degree production in computer and information science and support services at not-for-profit institutions has increased significantly between 2009 and 2015 (by 74 percent), above and beyond the general rate of increase of bachelor s degree production overall (16 percent) during this period. The rate of growth has varied over time, with two notable large declines but with a positive long-term trend, and it has differed by institution type and among individual institutions.
The Growth in Computing Degrees Finding 1 notes that the rate of bachelor-degree production in computing disciplines has increased by 74% between 2009 and 2015, over and above the increase in total degrees. Many universities have experienced larger increases. These occur because of the following institutional differences: The increase in degree production varies by institution type. In general, research-intensive universities and those that offer at least a master s degree have grown more rapidly than other institutional categories. Some computing fields have grown faster than others. At most institutions, the rate of growth in the core areas of computer science have outpaced their increases elsewhere. Institutions often deliberately constrain degree production in computing fields by limiting admission to the major. Such institutions naturally show much lower rates of growth.
An Example of Explosive Growth As an illustration of how institutional characteristics can lead to larger growth rates, this graph shows almost a 300% increase in CS majors at Ph.D.-granting universities covered by the CRA Taulbee Survey. 300% CS majors 250% 200% 150% 100% 50% 0% -50% Source: Computing Research Association, Generation CS, February 2017.
Degree Numbers Vary Over Time As Finding 1 notes, the rate of growth has varied over time, with two notable large declines, one beginning in 1985 and another beginning in 2005. 60,000 50,000 40,000 30,000 20,000 10,000 Source: National Center for Education Statistics, IPEDS database.
Misconceptions about Past Cycles Unfortunately, there is little common understanding about why such variations occur. The most widespread misconceptions are That degree production tracks computing employment with a lag. That the two historical declines occurred for the same reason. It is difficult to find any statistically significant data to support these claims. The evidence instead shows the following: The decline in CS degree production in the mid-1980s occurred at a time of rapidly rising employment. Although the decline in the early 2000s was triggered in part by the dot-com collapse, employment growth resumed after one year. Deliberate institutional action to reduce the number of CS majors was a major factor in both declines.
Finding 2 Enrollments in CS courses and the number of CS majors have risen markedly since 2005 at many institutions, and there is no indication that enrollments will fall in the near term. Both CS majors and non-majors have contributed significantly to the recent growth in enrollment in undergraduate CS courses. Information about current program enrollment trends suggests that the boom in enrollments has only begun to register in the data on CS degree production, and that CS bachelor s degree completions will rise sharply for at least the next few years in the absence of institutional actions to limit or discourage participation in the major.
Classrooms Are Overflowing The growing demand from both majors and non-majors for computer science courses means that enrollments have expanded rapidly at most universities and colleges.
Classrooms Are Overflowing The growing demand from both majors and non-majors for computer science courses means that enrollments have expanded rapidly at most universities and colleges. At some point, resources faculty capacity, TA availability, or classroom space become overwhelmed. As a result, some students are unable to take the computing courses they want and need.
Majors and Non-Majors Are Growing This chart from the CRA report shows dramatic growth at all levels of the curriculum for both majors and non-majors. Non-major growth is generally higher than overall growth even in mid- and upper-level courses. 18,000 Non-majors Majors +167% +170% 16,000 14,000 12,000 +51% +50% 10,000 +186% +242% 8,000 +146% +151% 6,000 4,000 2015 2005 2010 2015 2005 2010 2005 2010 2015 2005 2010 2015 2,000 0 Intro Nonmajors (51) Intro Majors (66) Mid-level (66) Upper-level (66) Source: Computing Research Association, Generation CS, February 2017.
Surveys Show Little Sign of a Decline The HERI Freshman Survey of intended majors suggests that growth is still on an upward trajectory. 5% 4% 3% 2% 1% Percentage of students intending to major in CS Percentage of degrees awarded in CS Source: Higher Education Research Institute, UCLA.
Finding 3 With more than half of new CS Ph.D.s drawn to opportunities in industry, hiring and retaining CS faculty is currently an acute challenge that limits institutions abilities to respond to increasing CS enrollments.
Faculty Hiring Lags Behind Demand Although institutions have started to hire more faculty in dedicated teaching lines, faculty numbers have not kept pace. Growth rates for CS majors and faculty at Ph.D.-granting institutions 300% CS majors 250% Tenure-line faculty Teaching-line faculty 200% 150% 100% 50% 0% -50% Source: Computing Research Association, Generation CS, February 2017.
The Challenge of Faculty Recruitment The CRA Taulbee survey tracks where North American Ph.D. graduates take jobs. In 2015, the distribution looks like this: Outside North America (8%) Industry (57%) Academia (29%) Government (3%) Other (3%) Some academic jobs, however, do not involve teaching: Postdoctoral positions (10%) Research positions (2%) Even among those few Ph.D.s taking faculty positions, some will be gobbled up by a voracious industry.
The Shortage of Faculty Candidates According to the CRA Taulbee Survey, 1780 Ph.D. degrees in computer science were awarded in 2015. If only 18 percent of Ph.D. recipients take teaching positions in academia, that means there are only 320 new Ph.D.s available to fill faculty positions in the 1577 colleges and universities that offer CS Bachelor s degrees. On average, institutions can therefore expect to hire roughly 0.2 new Ph.D.s per year, or one Ph.D. every five years. Many institutions are looking for many more faculty to meet the expanding student demand. Northwestern University, for example, is seeking to hire 20 new computer science faculty. That number is 100 times the average institutional share.
The Situation Beyond the R1 Institutions The situation is much more difficult for schools outside the 115 universities that constitute the Carnegie R1 class of doctoral institutions with the highest research activity. Of last year s Ph.D. graduates taking faculty positions, 83 percent chose positions in R1 universities, leaving only 17 percent of the available candidates for the other 1462 colleges and universities that offer Bachelor s degrees. Given the current rate of Ph.D. production, institutions that fall outside the R1 category can reasonably expect to hire just one new Ph.D. every 27 years.
Finding 4 Employment in computing fields has grown steadily since 1975, and the number of jobs in computing occupations far exceeds bachelor s degree production in CS. The Bureau of Labor Statistics (BLS) projects that employment in computer occupations will rise more quickly than overall job growth for at least the next several years.
The Growth of Computing The computing industry has grown enormously since the beginning of the information age so that it now represents 6% of the U.S. economy. Prior to 1978, the Bureau of Labor Statistics did not have a separate classification for computing occupations. From 1978 to 2015, employment in the computing sector has risen from 219,000 to 4,106,000, representing an 1800% increase during a time when total employment rose by only 58%. Even more dramatic is the explosion in the role that computers play in every aspect of our society. Technological change has been incredibly rapid, and the resulting economic changes have radically transformed the nature and structure of the workforce. This rise is perhaps most evident in the growth of technology companies over the last decade, as shown on the next slide.
The Five Largest Industrial Corporations 2007 2012 2017 1. 1. 1. Petrochina Apple Apple $546B $724B $801B 2. 2. 2. Exxon/Mobil Exxon/Mobil Alphabet $512B $400B $680B 3. 3. 3. General Electric PetroChina Microsoft $375B $258B $540B 4. 4. 4. China Mobil Microsoft Amazon $354B $257B $476B Industrial and Commercial Bank of China $339B $236B $409B 5. 5. 5. Wal-Mart Facebook
Employment Growth Has Been Steady Data from the Bureau of Labor Statistics show that employment in computing has risen by almost a factor of 20 since 1978. Unfortunately, statistics from the period covering the dot-com collapse are unreliable because of changes in classification. 4.0M 3.5M 3.0M 2.5M 2.0M 1.5M 1.0M 0.5M 0 Source: Bureau of Labor Statistics.
Recovering the Missing Years Research by John Bound and Nicolas Morales removes the gap by looking at categories that did not change. Their data suggest that employment declined by more than 1% in only two periods: 2001 and 2008-2009. The first was followed by a decline in CS majors; the second was followed by a sharp increase. 3.0M 2.5M 2.0M 1.5M 1.0M 0.5M 0 Source: Bound and Morales, Workforce Trends in Computer Science, August 2016.
BLS Data Show Strong Job Growth Projected Total Employment for STEM Jobs in 2024 3% 5% 5% Computing Engineering Life Sciences 24% Physical Sciences 63% Mathematics/Statistics Source: Bureau of Labor Statistics 2014-2024 projections.
Computing Will See the Fastest Growth Percentage of STEM Job Growth 2014-2024 7% 3% 3% 10% Computing Engineering Life Sciences Physical Sciences Mathematics/Statistics 77% Source: Bureau of Labor Statistics 2014-2024 projections.
Degree Production Falls Short of Need 140,000 Ph.D. 120,000 Master s 100,000 Bachelor s Projected job openings 80,000 60,000 40,000 20,000 Mathematics/ Statistics Physical Sciences Life Sciences Engineering Computer Science Computing is the only major sector of the economy in which the number of jobs exceeds the supply of people with degrees. Sources: Degree data from the National Center for Education Statistics 2014; projected annual job openings from the Bureau of Labor Statistics 2014- 2024 projections. The idea for this graph comes from a presentation by John Sargent, Senior Policy Analyst, Department of Commerce, at the CRA Computing Research Summit in 2004.
Finding 5 Computing is pervasive, and its penetration is deep and growing in virtually all sectors of the economy, all academic disciplines, and all aspects of modern life. The broad opportunities in computing, both in the labor market and for enabling a host of intellectual pursuits, will continue to be drivers of increasing enrollments in undergraduate computer science, from both majors and non-majors. While there will probably be fluctuations in the demand for CS courses, demand is likely to continue to grow or remain high over the long term.
Computing Is Pervasive At the public meeting for the National Academies report in August 2016, several of the speakers discussed the growing importance of computing to a wide range of disciplines. The increased importance of computing is reflected in the proliferation of CS+X programs that combine computer science with some other discipline. The centrality of computing is further indicated by the growing number of jobs that require computing expertise.
Jeannette Wing: Computational Thinking Dr. Jeannette Wing of Microsoft Research (formerly at Carnegie Mellon) offered an update on her 2006 article introducing the idea of Computational Thinking. In her talk, Dr. Wing predicted that computational thinking will be a fundamental skill used by everyone in the world by the middle of the 21st century. Source: Jeannette Wing, slides from August 2016 public workshop.
Alfred Spector: The Expanding Sphere Dr. Alfred Spector, founder and CEO of Two Sigma Ventures and formerly at Google and Carnegie Mellon, likened computer science today to an expanding sphere that touches every discipline. Dr. Spector noted that the growth offers vast opportunity at the edge as the sphere expands into Xi CS+Xi(CS+X for all X). Prophetically, Dr. Spector initially used this slide in a talk at Harvard in 2004. Source: Alfred Spector, slides from August 2016 public workshop.
Rob Rutenbar: Go Big, Go Wide, Go Deep Dr. Rob Rutenbar of the University of Illinois at Urbana-Champaign noted the variety of connections between computation and other fields. Science Business/La w Societal Health, Med Compute + Data These connections form the foundation for the CS+X program at UIUC. Social Sci Humanities Art / Design Source: Rob Rutenbar, slides from August 2016 public workshop.
Computing Jobs Exist in Many Areas Burning Glass Technologies estimates that 45 percent of all jobs that require advanced computer science training are outside the traditional IT sector. 4% 5% 14% Information Technology Data Analysis Engineering 55% Science Arts and Design 22% Source: Burning Glass Technologies, Beyond Point and Click.
Computing Is Important for Better Jobs The demand for coding skills rises with income. Coding skills are almost nonexistent in the lower income quartiles, but half of all top-quartile jobs require the ability to code. Source: Burning Glass Technologies, Beyond Point and Click.
Finding 6 CS and CIS have historically had low representation of women and underrepresented minorities. This trend of underrepresentation in bachelor s degree completions had not improved significantly as of 2015, but there is some evidence that representation may be improving among students currently majoring or interested in majoring in CS.
Gender Diversity The percentage of computer science bachelor s degrees awarded to women rose steadily until 1984 but has declined since. The declines in women s participation start earlier than the overall downturns but do not rise during the dot-com peak. 35% 70,000 30% 60,000 25% 50,000 20% 40,000 15% 30,000 10% 20,000 Percentage of CS degrees awarded to women Total number of degrees awarded in CS 5% 10,000 Source: National Center for Education Statistics, IPEDS database.
Racial and Ethnic Diversity The percentage of degrees awarded to underrepresented groups has been rising over time but nonetheless remains a challenge. This graph shows the change over time of broad racial and ethnic categories. 90% 80% 70% White Underrepresented minority Asian/Pacific islander Temporary resident Other 60% 50% 40% 30% 20% 10% Source: National Center for Education Statistics, IPEDS database.
Underrepresented Minorities This graph splits the underrepresented minority category into Black, Hispanic/Latinx, and American Indian/Alaska Native. 14% Black, non-Hispanic Hispanic or Latinx American Indian or Alaska Native, non-Hispanic 12% 10% 8% 6% 4% 2% Source: National Center for Education Statistics, IPEDS database.
Interpreting Diversity Numbers The committee was initially surprised to discover that unlike female students Black and Hispanic/Latinx students represent roughly the same proportion of computer science degrees as they do of all bachelor s degrees. This seeming parity, however, is misleading for the following reasons: Black and Hispanic/Latinx students earn bachelor s degrees at a lower rate relative to their percentage in the overall population. Students from underrepresented minorities are more likely to get degrees from for-profit and minority-serving institutions. Completion rates in computer science for Black and American Indian/Alaska Native students have declined in the current surge. The next three slides discuss these issues in more detail.
Degrees as a Fraction of Population The following graph breaks out the Black, Hispanic/Latinx, and American Indian/Alaska Native categories. students is close to line representing the fraction of all degrees. The fraction of CS degrees going to Black and Hispanic/Latinx Comparing degrees against the total population reveals the gap. % Difference in CS degree percentage relative to percentage of the U.S. population Difference in CS degree percentage relative to percentage of all bachelor s degrees +6 Black Hispanic/Latinx +4 +2 6.5 point gap 0 % 11 point gap 2 4 6 Black Hispanic/Latinx 8 10 12 Source: National Center for Education Statistics, IPEDS database.
The Lack of Institutional Balance The fact that the fraction of computer science degrees awarded to Black and Hispanic/Latinx students appears to track the overall number of bachelor s degrees fails to take account of disparities in diversity at different institutional types. Students from underrepresented minorities are more likely to get degrees from for-profit institutions. As the report notes: Degrees awarded to Hispanic or Latina females, American Indian or Alaska Native students, and black or African American students have a much more significant contribution from for-profit institutions, which typically do not provide exposure to research or the environment of institutions with advanced degrees, or access to top recruiters and job opportunities. Underrepresented students are also more likely to earn degrees from minority-serving institutions.
Losing Ground in the Current Surge Although the proportion of Hispanic/Latinx students has risen slightly since 2009, the proportion of degrees has fallen for both Black and American Indian/Alaska Native students. The report offers the following insight into recent changes in the percentages of CS degrees going to Black students: While the absolute number of Black or African American students completing computer science and related degrees has increased in the current surge, this increase has been slower than that of other race/ethnic groups. As a result, the share of CS, CE, and IS degrees going to African Americans actually decreased between 2009 and 2015.
Finding 7 There is no guarantee that the representation of women and underrepresented minorities in CS will improve without a focused effort. Retention is always a challenge, and adverse conditions associated with high demand for courses as well as actions taken by institutions in order to manage enrollments could negatively impact the inclusiveness of undergraduate computing programs.
Dangers of Enrollment Limitation Declines in the percentage of degrees awarded to women follow periods of enrollment limitation and never recover. . Although the evidence is not sufficient to establish causality, the correlation is strong enough to be of significant concern. 35% 30% 25% 20% 15% Periods of widespread enrollment limitation 10% 5% Percentage of CS degrees awarded to women Source: National Center for Education Statistics, IPEDS database.
Locking the Clubhouse Women tend to have less experience with computing and to take introductory computer science courses later in college. Limitation strategies that privilege prior experience or early entry therefore screen out a higher proportion of women. In this example, women are only 15 percent of the class but form a larger fraction of the students who are locked out.
Finding 8 Departments facing sharp increases in demand for computing courses have experienced significant strain on a wide range of resources. Failure to respond thoughtfully to the demand and the resource deficits will result in adverse conditions for students, faculty, the programs, and the institution as a whole in the near or long term. Conditions such as an unwelcoming academic climate and loss of faculty members can be especially harmful in the long term.
The Effects of Enrollment Limitation During past enrollment booms, many departments have sought to restrict demand by restricting admission to the major or by imposing enrollment limits on computer science courses. For the expansion in the early 1980s, the most comprehensive analysis comes from reports written at two universities that prepared extensive histories outlining the challenges of that time: A history of the computer science department at Purdue, written by John Rice and Saul Rosen in 1990. A historical analysis of computer science at the University of Maryland, written by Marvin Zelkowitz in 2007. The next two slides show how admission restrictions affected the number of computer science majors at these universities.
Enrollment Limitations at Purdue Purdue restricted admission to its major in 1982, but students sought to circumvent the restrictions by becoming premajors. The premajor category was eliminated in 1985. Newly admitted majors 500 Majors per year Premajors 400 300 200 100 0 Source: Rice and Rosen, History of the Computer Sciences Department at Purdue University, 1990.
Enrollment Limitations at Maryland The University of Maryland enforced limitations on class size beginning in 1982 and restricted admission to its major in 1984, leading to a decline in majors over the next few years. Current majors (all years) 2000 1500 1000 500 0 Source: Marvin Zelkowitz, Maturation of Computer Science Research and Education at the University of Maryland, 2007
Common Patterns The historical data from Purdue and Maryland show a common pattern in which imposing restrictions on the CS major lead to subsequent declines in the number of CS bachelor s degrees. Similar patterns exist at other universities. Rice and Rosen note that the crisis was in fact national and that enrollments were ballooning wherever they were not strictly limited. Many universities chose to restrict the number of CS majors well below its existing level. UC Berkeley, for example, producedapproximately300new CS graduates a year in the early 1980s. The imposition of departmental limits in the mid 1980s cut that back to around 100 graduates a year. The crisis in the 1980s was extensivelyanalyzed in a 1982 report by Kent Curtis of the National Science Foundation, excerpts from which appear on the next three slides.
Excerpts from the Kent Curtis Report COMPUTER MANPOWER - IS THERE A CRISIS? Kent K. Curtis National Science Foundation Washington, D.C.. 20550 ABSTRACT The educational institutions of the U.S. have what might be described as a crisis, a staffing problem which seems to have no solution within the context of normal supply/demand forces. Factors influencing the supply and demand of computer manpower are analyzed in the context of available data on scientific manpower including statistics on degrees awarded in various discipline at the Bachelor s,Master s, and Ph.D. levels, faculty mobility, job mobility among professionals, starting salary trends. comparative unemployment statistics and economic projections. It is found that there is a shortage of computer manpower which is expected to persist for the foreseeable future but that society is responding, perhaps as rapidly as possible, to provide the trained people required by business, industry and government. Only the educational institutions of the U.S. have what might be described as a crisis, a staffing problem which seems to have no solution within the context of normal supply/demand forces. Source: Kent Curtis, Computer Manpower Is There A Crisis?, 1982.
Excerpts from the Kent Curtis Report 4.1 Higher Education [Computer Science] is experiencing an exponentially increasing demand for its product with an inelastic labor supply. How has it reacted? . . . 80% of the universities are responding by increasing teaching loads. 50% by decreasing course offerings and concentrating their available faculty on larger but fewer courses, and 66% are using more graduate-student teaching assistants or part-time faculty. 35% report reduced research opportunities for faculty as a result. In brief, they are using a combination of rational management measures to adjust as well as they can to the severe manpower constraints under which they must operate. However, these measures make the universities environments less attractive for employment and are exactly counterproductive to their need to maintain and expand their labor supply. They are also counterproductive to producing more new faculty since the image graduate students get of academic careers is one of harassment, frustration, and too few rewards. The universities are truly being choked by demand for their own product and have a formidable people-flow problem, analogous to but much more difficult to address than the cash-flow problem which often afflicts rapidly growing businesses. There are no manpower banks which can provide credit. [Universities] are using a combination of rational management measures to adjust as well as they can to the severe manpower constraints under which they must operate. However, these measures make the universities environments less attractive for employment and are exactly counterproductive to their need to maintain and expand their labor supply. Source: Kent Curtis, Computer Manpower Is There A Crisis?, 1982.


