Explore the impact of CD90 and CD34 marker enrichment on other markers, migration behavior of enriched cell fractions, and background gating in Cisplatin-treated cells through in-depth analysis and experimental data.
Please find below an Image/Link to download the presentation.
The content on the website is provided AS IS for your information and personal use only. It may not be sold, licensed, or shared on other websites without obtaining consent from the author. If you encounter any issues during the download, it is possible that the publisher has removed the file from their server.
You are allowed to download the files provided on this website for personal or commercial use, subject to the condition that they are used lawfully. All files are the property of their respective owners.
The content on the website is provided AS IS for your information and personal use only. It may not be sold, licensed, or shared on other websites without obtaining consent from the author.
E N D
Presentation Transcript
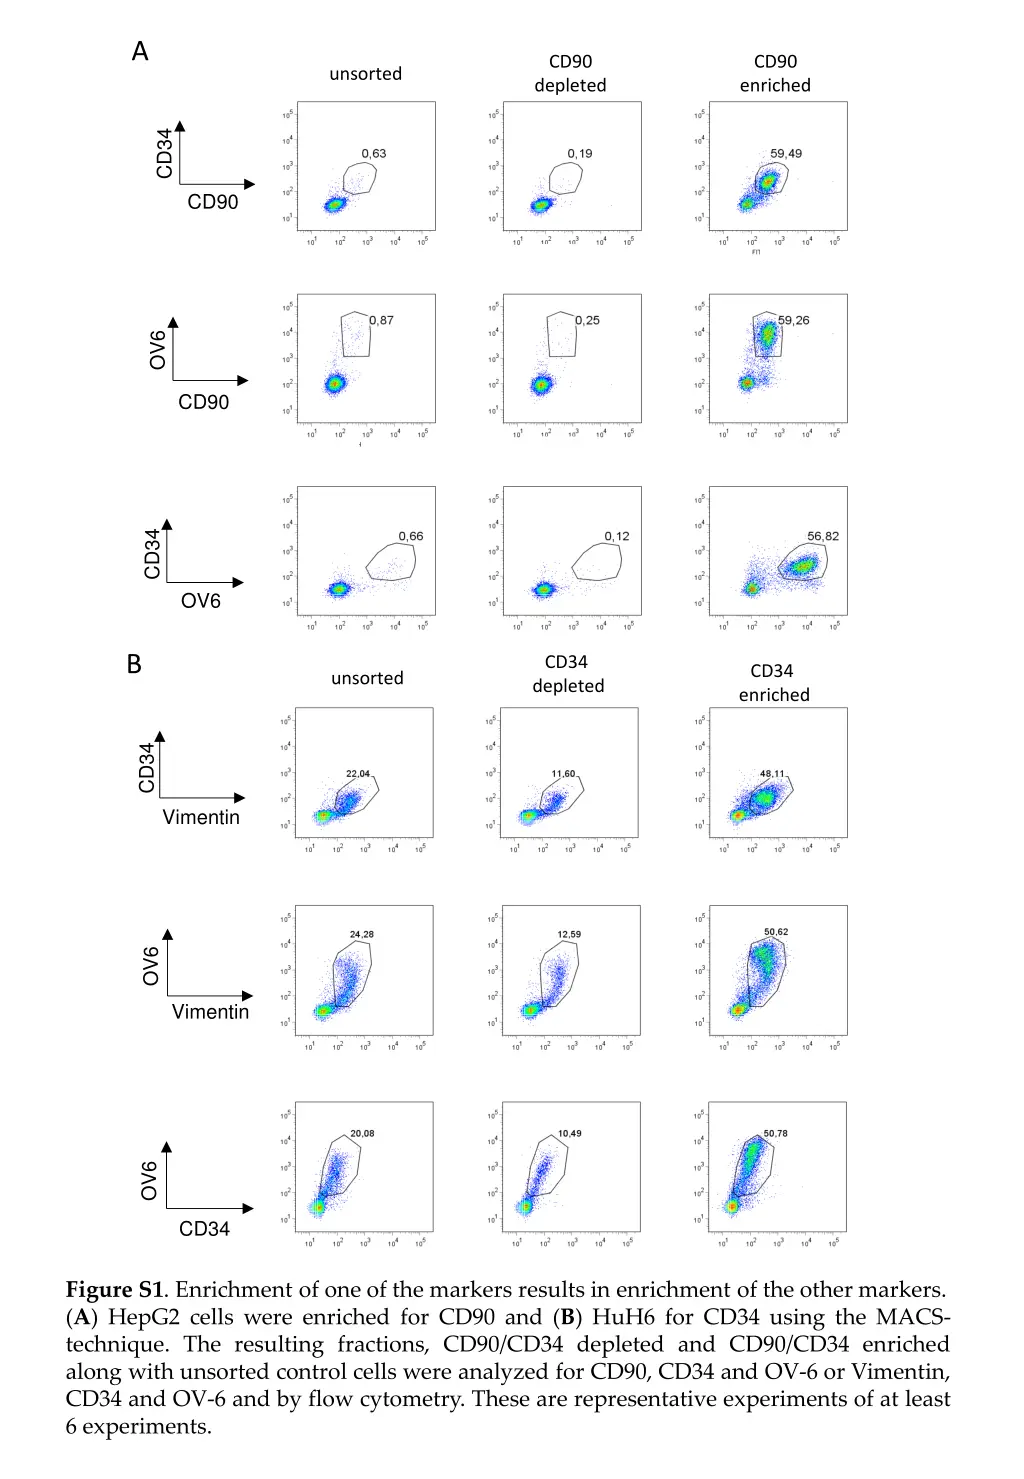
A CD90 depleted CD90 enriched unsorted CD34 CD90 OV6 CD90 CD34 OV6 B CD34 depleted CD34 enriched unsorted CD34 Vimentin OV6 Vimentin OV6 CD34 Figure S1. Enrichment of one of the markers results in enrichment of the other markers. (A) HepG2 cells were enriched for CD90 and (B) HuH6 for CD34 using the MACS- technique. The resulting fractions, CD90/CD34 depleted and CD90/CD34 enriched along with unsorted control cells were analyzed for CD90, CD34 and OV-6 or Vimentin, CD34 and OV-6 and by flow cytometry. These are representative experiments of at least 6 experiments.
HepG2 B A * 120 20 * * 100 relat. expression relat. expression 15 80 * * 60 10 40 5 20 0 0 CD90- CD90+ CD90- CD90+ CD90- CD90+ CD90- CD90+ CD90- CD90+ CD90- CD90+ CD90- CD90+ CD90- CD90+ CD90- CD90+ CD90- CD90+ CD90- CD90+ SNAI1 TWIST1 Vimentin E- Occludin Oct4 Nanog c-myc EpCAM AFP Albumin Cadherin HuH6 D C * * * 9 120 8 relat. expression relat. expression 100 7 80 6 5 60 4 40 3 * 2 20 1 0 0 CD90+ CD90+ CD90+ CD90+ CD90+ CD90- CD90- CD90- CD90- CD90- CD90+ CD90- CD90+ CD90- CD90+ CD90- CD90+ CD90- CD90+ CD90- CD90- CD90+ SNAI1 TWIST Vimentin E- Occludin Oct4 Nanog c-myc EpCAM AFP Albumin Cadherin Figure S2. CD90-sorted cellshave increased expression of pluripotency and EMT factors. (A) Gene expression was calculated for HepG2 in CD90 depleted (CD90-) and enriched (CD90+) fractions for Oct4, Nanog, c-myc, EpCAM, AFP and Albumin and (B) SNAIL1, TWIST1, Vimentin, E-Cadherin and Occludin and the same for HuH6 (C and D). The fold- change values of the CD90- population were normalized to 1 and the values of CD90+ were calculated in relation to the respective values of CD90-. The columns represent the mean with error bars depicting standard deviation from the mean. The experiment was repeated at least 6 times. A two-tailed Wilcoxon ranked test was performed in order to calculate the significance of the data (*p<0.05).
200% 180% Relative migration behaviour 160% 140% 120% 100% 80% 60% 40% 20% 0% CD90 depletierte Zellen CD90 depleted CD90 angereicherte Zellen CD90enriched Figure S3. CD90-enriched cell fraction migrates to a higher extent. Migration assays were performed with CD90-MACS depleted and enriched cells as well as unsorted cells. 24hrs after incubation the migrated cells of all three groups were counted. The migrated cells of the unsorted group were set at 100% and the migrated cells of the CD90 depleted and enriched groups were then calculated in relation to the unsorted cells. The values presented are the mean with error bars depicting standard deviation from the mean. The experiment was performed 3 times.
triple IgG-BV421 IgG-APC control OV-6- APC CD34- BV421 Cisplatin (2.5 g/mL) triple IgG-BV421 IgG-PE control Vimentin- PE CD34- BV421 Cisplatin (2.5 g/mL) triple IgG-APC IgG-PE control Vimentin- PE OV-6- APC Cisplatin (2.5 g/mL) Figure S4. Background gating strategy of Cisplatin treated HuH6 cells. After 72hrs of Cisplatin treatment (2.5 g/mL), treated and controls cells were stained for CD34, OV-6 and Vimentin simultaneously (triple) or with IgG-controls coupled with the BV421, APC or PE fluophores.
triple IgG-BV421 IgG-APC control OV-6- APC CD34- BV421 Cisplatin (2.5 g/mL) IgG-PE triple IgG-BV421 control Vimentin- PE CD34- BV421 Cisplatin (2.5 g/mL) triple IgG-APC IgG-PE control Vimentin- PE OV-6- APC Cisplatin (2.5 g/mL) Figure S5. Background gating strategy of Cisplatin treated HepG2 cells. After 72hrs of Cisplatin treatment (2.5 g/mL), treated and controls cells were stained for CD34, OV-6 and Vimentin simultaneously (triple) or with IgG-controls coupled with the BV421, APC or PE fluophores.
triple IgG-APC IgG-BV421 control OV-6- APC CD34- BV421 17-AAG (100nM) IgG-PE triple IgG-BV421 control Vimentin- PE CD34- BV421 17-AAG (100nM) triple IgG-APC IgG-PE control Vimentin- PE OV-6- APC 17-AAG (100nM) Figure S6. Background gating strategy 17-AAG treated HuH6 cells. After 48hrs of 17-AAG treatment (100nM), treated and controls cells were stained for CD34, OV-6 and Vimentin simultaneously (triple) or with IgG-controls coupled with the BV421, APC or PE fluophores.
A B ns ns 60 100 Relative cell viability (%) CD34+OV-6+ cells (%) 50 80 40 60 30 ns 40 20 20 10 n.d. 0 0 0 0.1 0.25 0 0.1 0.25 17-AAG ( M) 17-AAG ( M) Figure S7. Effect of 17-AAG on HepG2 seems to be of general cytotoxic nature. HepG2 cells were treated with 0, 0.1 and 0.25 M 17-AAG, respectively. (A) After 48hrs, cell viability was measured in an MTT assay. The presented values with error bars depicting the standard deviation from the mean. The experiment was repeated 3 times. A two-tailed Wilcoxon ranked test was performed in order to calculate the significance of the data (*p<0.05). (B) Additionally, the cells were measured for CD34 expression and OV-6 binding by flow cytometry. The values represent the mean with error bars depicting the standard deviation from the mean. The assay was performed 3 times. A Dunn s multiple comparisons test was performed in order to calculated the significance of the data (*p<0.05).
triple IgG-APC IgG-BV421 control OV-6- APC 17-AAG + Cisplatin CD34- BV421 IgG-PE triple IgG-BV421 control Vimentin- PE CD34- BV421 17-AAG + Cisplatin triple IgG-APC IgG-PE control Vimentin- PE OV-6- APC 17-AAG + Cisplatin Figure S8. Background gating strategy of 17-AAG+Cisplatin treated HuH6 cells. After 48hrs of 17-AAG treatment (100nM), cells were treated with Cisplatin (2 g/mL) for 72hrs. Control and treated cells and were stained for CD34, OV-6 and Vimentin simultaneously (triple) or with IgG-controls coupled with the BV421, APC or PE fluophores.
Table S1: qPCR primers Gene name Forward primer (5 -3 ) Reverse primer (5 -3 ) Source Oct4 GAGGCAACCTGGAGAATTTG CGGTTACAGAACCACACTCG NM_002701 Nanog GAACTCTCCAACATCCTGAACC GCGTCACACCATTGCTATTC NM_024865 c-myc CGGTGCAGCCGTATTTCTAC CAGCAGCTCGAATTTCTTCC NM_001354870 Osta et al. EpCAM CGCAGCTCAGGAAGAATGTG TGAAGTACACTGGCATTGACG TTGCTTTTGCTTCACAAGGTTAA TGAG Yang et al. AFP GGTGGTGGATGAAACATATG Yang et al. Albumin TGCACAGAATCCTTGGTGAA TTCACGAGCTCAACAAGTGC SNAI1 CTCTTTCCTCGTCAGGAAGC TAGGGCTGCTGGAAGGTAAAC NM_005985 Twist1 CAAGCTGAGCAAGATTCAGACC CAGCTTGCCATCTTGGAGTC NM_000474 Vimentin TCCACGAAGAGGAAATCCAG GGCTTGGAAACATCCACATC NM_003380 E-Cadherin CCTGGGCAGAGTGAATTTTG GAAACCGTAGAGGCCTTTTG NM_004360 GTCGAGGAGTGGGTTAAAAAT G Occludin ATGCCATGGGACTGTCAAC NM_002538 CAACACCTAGTACCCTTGGAAG T Cheng et al. CD34 ACTGTCGTTTCTGTGATGTTTGT Woeller et al. CD90 ATCTCCTCCCAGAACGTC ATCTCTGCACTGGAACTTG KRT14 AGAGAAGAACCGCAAGGATG AATCTCCAGGTTCTGCATGG NM_000526 ACTB ACTCTTCCAGCCTTCCTTCC TGTTGGCGTACAGGTCTTTG NM_001101 Osta, W.A.; Chen, Y.; Mikhitarian, K.; Mitas, M.; Salem, M.; Hannun, Y.A.; Cole, D.J.; Gillanders, W.E. EpCAM is overexpressed in breast cancer and is a potential target for breast cancer gene therapy. Cancer Res. 2004, 64, 5818 5824. Yang, Z.F.; Ho, D.W.; Ng, M.N.; Lau, C.K.; Yu, W.C.; Ngai, P.; Chu, P.W.K.; Lam, C.T.; Poon, R.T.P.; Fan, S.T. Significance of CD90+ cancer stem cells in human liver cancer. Cancer Cell 2008, 13, 153 166. Chen, Q.; Khoury, M.; Limmon, G.; Choolani, M.; Chan, J.K.Y.; Chen, J. Human fetal hepatic progenitor cells are distinct from, but closely related to, hematopoietic stem/progenitor cells. Stem Cells 2013, 31, 1160 1169. Woeller, C.F.; O Loughlin, C.W.; Pollock, S.J.; Thatcher, T.H.; Feldon, S.E.; Phipps, R.P. Thy1 (CD90) controls adipogenesis by regulating activity of the Src family kinase, Fyn. FASEB J. 2015, 29, 920 931.