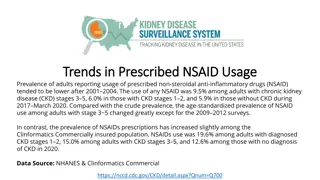
CKD Prevalence and Risk Factors Analysis
Explore data from the US Renal Data System 2013 Annual Data Report on the prevalence of chronic kidney disease (CKD) in the general population within different demographic categories such as age, gender, race/ethnicity, and associated risk factors like diabetes and cardiovascular disease. Analyze the distribution of NHANES participants based on markers of CKD, eGFR, and ACR, along with adjusted odds ratios of CKD in different population segments. Gain insights from cumulative eGFR and ACR distribution curves to understand the prevalence and impact of CKD.

Download Presentation

Please find below an Image/Link to download the presentation.
The content on the website is provided AS IS for your information and personal use only. It may not be sold, licensed, or shared on other websites without obtaining consent from the author.If you encounter any issues during the download, it is possible that the publisher has removed the file from their server.
You are allowed to download the files provided on this website for personal or commercial use, subject to the condition that they are used lawfully. All files are the property of their respective owners.
The content on the website is provided AS IS for your information and personal use only. It may not be sold, licensed, or shared on other websites without obtaining consent from the author.
E N D
Presentation Transcript
CKD: Chapter One CKD in the general population United States Renal Data System 2013 Annual Data Report USRDS 2013 ADR
Distribution of NHANES 20052010 participants with diabetes, cardiovascular disease, & single-sample markers of CKD Figure 1.1 (Volume 1) NHANES participants 2005 2010, age 20 & older; single-sample estimates of eGFR & ACR. USRDS 2013 ADR
Prevalence (%) of CKD in the NHANES population within age, gender, race/ethnicity, & risk factor categories Table 1.a (Volume 1) NHANES 1988 1994 & 2005 2010 participants age 20 & older; single-sample estimates of eGFR & ACR. eGFR calculated using the CKD-EPI equation. eGFR calculated using the CKD-EPI equation. USRDS 2013 ADR
Cumulative eGFR distribution curves of NHANES participants Figure 1.2 (Volume 1) NHANES 1988 1994 & 2005 2010 participants age 20 & older; single-sample estimates of eGFR. eGFR calculated using the CKD-EPI equation. eGFR calculated using the CKD-EPI equation. USRDS 2013 ADR
Cumulative urine albumin/creatinine ratio (ACR) distribution curves of NHANES participants Figure 1.3 (Volume 1) NHANES 1988 1994 & 2005 2010 participants age 20 & older; single-sample estimates of ACR. USRDS 2013 ADR
Adjusted odds ratios of CKD in NHANES participants, by risk factor Figure 1.4 (Volume 1) NHANES 1988-1994 & 2005-2010 participants age 20& older; single sample estimates of eGFR and ACR. Adjusted: age, gender, race; eGFR calculated using CKD-EPI equation. USRDS 2013 ADR
Adjusted odds ratios of spot eGFR <60 ml/min/1.73 m2 in NHANES participants, by risk factor Figure 1.5 (Volume 1) NHANES 1988-1994 & 2005-2010 participants age 20& older; single sample estimates of eGFR and ACR. Adjusted: age, gender, race; eGFR calculated using CKD-EPI equation. USRDS 2013 ADR
Adjusted odds ratios of spot urine albumin/ creatinine ratio (ACR) 30 mg/g in NHANES participants, by risk factor Figure 1.6 (Volume 1) NHANES 1988-1994 & 2005-2010 participants age 20& older; single sample estimates of eGFR and ACR. Adjusted: age, gender, race; eGFR calculated using CKD-EPI equation. USRDS 2013 ADR
NHANES participants with spot urine albumin/creatinine ratio (ACR) 30 mg/g, by spot eGFR range Figure 1.7 (Volume 1) NHANES 1988 1994 & 2005 2010 participants age 20 & older; single sample estimates of eGFR & ACR. USRDS 2013 ADR
NHANES participants with CKD, by age & risk factor Figure 1.8 (Volume 1) NHANES 1988 1994 & 2005 2010 participants age 20 & older; single sample estimates of eGFR & ACR. Diabetes defined as A1c <7 percent, self-reported (SR), or currently taking glucose-lowering medications. Hypertension defined as BP 130/ 80 for those with diabetes or CKD, otherwise BP 140/ 90, or taking medication for hypertension. eGFR calculated using the CKD-EPI equation. USRDS 2013 ADR
NHANES participants with spot eGFR < 60 ml/min/1.73 m2, by age & risk factor Figure 1.9 (Volume 1) NHANES 1988 1994 & 2005 2010 participants age 20 & older; single sample estimates of eGFR & ACR. Diabetes defined as A1c <7 percent, self-reported (SR), or currently taking glucose-lowering medications. Hypertension defined as BP 130/ 80 for those with diabetes or CKD, otherwise BP 140/ 90, or taking medication for hypertension. eGFR calculated using the CKD-EPI equation. USRDS 2013 ADR
NHANES participants with spot urine albumin/creatinine ratio (ACR) 30 mg/g, by age & risk factor Figure 1.10 (Volume 1) NHANES 1988 1994 & 2005 2010 participants age 20 & older; single sample estimates of eGFR & ACR. Diabetes defined as A1c <7 percent, self-reported (SR), or currently taking glucose-lowering medications. Hypertension defined as BP 130/ 80 for those with diabetes or CKD, otherwise BP 140/ 90, or taking medication for hypertension. eGFR calculated using the CKD-EPI equation. USRDS 2013 ADR
Distribution of markers of CKD in NHANES participants with diabetes & hypertension, 2005 2010 Figure 1.11 (Volume 1) NHANES 1988 1994 & 2005 2010 participants age 20 & older; single sample estimates of eGFR & ACR. eGFR calculated using the CKD-EPI equation. USRDS 2013 ADR
Distribution of markers of CKD in NHANES participants with cardiovascular disease & obesity, 2005 2010 Figure 1.11 (continued, Volume 1) NHANES 1988 1994 & 2005 2010 participants age 20 & older; single sample estimates of eGFR & ACR. eGFR calculated using the CKD-EPI equation. USRDS 2013 ADR
Awareness, treatment, & control of hypertension, hyperlipidemia, HDL, total cholesterol, & diabetes Table 1.b (Volume 1) NHANES 1988 1994 & 2005 2010 participants age 20 & older; single sample estimates of eGFR & ACR. eGFR calculated using the CKD-EPI equation. USRDS 2013 ADR
NHANES participants at target blood pressure Figure 1.12 (Volume 1) NHANES 1988 1994 & 2005 2010 participants age 20 & older; single sample estimates of eGFR & ACR; dialysis patients excluded from NHANES 2005 2010. eGFR calculated using the CKD-EPI equation. This figure cannot be directly compared to values in Table 1.b. The table represents NHANES participants who are classified as hypertensive (measured/treated) but some of those are at target blood pressure. Represents all hypertensives plus those hypertensives who are at target blood pressure probably due to medication. USRDS 2013 ADR
NHANES participants within LDL cholesterol target range Figure 1.13 (Volume 1) NHANES 1988 1994 & 2005 2010 participants age 20 & older; single sample estimates of eGFR & ACR; dialysis patients excluded from NHANES 2005 2010. eGFR calculated using the CKD-EPI equation. USRDS 2013 ADR
NHANES participants within HDL cholesterol target range Figure 1.14 (Volume 1) NHANES 1988 1994 & 2005 2010 participants age 20 & older; single sample estimates of eGFR & ACR; dialysis patients excluded from NHANES 2005 2010. eGFR calculated using the CKD-EPI equation. USRDS 2013 ADR
NHANES participants with glycohemoglobin <7% Figure 1.15 (Volume 1) NHANES 1988 1994 & 2005 2010 participants age 20 & older; single sample estimates of eGFR & ACR; dialysis patients excluded from NHANES 2005 2010. eGFR calculated using the CKD-EPI equation. USRDS 2013 ADR
Life expectancy of NHANES participants with or without CKD, 1999 2004 Figure 1.16 (Volume 1) NHANES 1999 2004 participants age 20 & older; single sample estimates of eGFR & ACR. eGFR calculated using the CKD-EPI equation. USRDS 2013 ADR


 of CKD in the NHANES")