Confidence and Prediction Intervals in Meta-analysis with Metafor
Learn about the importance of confidence intervals for REVC and I-squared, as well as prediction intervals for mean estimates in meta-analysis using Metafor in R. Explore how uncertainty is assessed and how to compute prediction intervals with Higgins' method.

Download Presentation

Please find below an Image/Link to download the presentation.
The content on the website is provided AS IS for your information and personal use only. It may not be sold, licensed, or shared on other websites without obtaining consent from the author. If you encounter any issues during the download, it is possible that the publisher has removed the file from their server.
You are allowed to download the files provided on this website for personal or commercial use, subject to the condition that they are used lawfully. All files are the property of their respective owners.
The content on the website is provided AS IS for your information and personal use only. It may not be sold, licensed, or shared on other websites without obtaining consent from the author.
E N D
Presentation Transcript
Meta-analysis in R with Metafor 9: Basic Confidence and Prediction Intervals Confidence intervals for the REVC & I-squared, Prediction or Credibility intervals for the mean
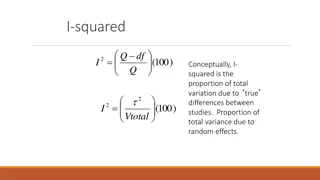
Confidence Intervals for the Variance We typically find confidence intervals only for the mean, but REVC is very important in meta-analysis REVC is often poorly estimated. Therefore Important to know the magnitude of uncertainty about it I-squared is an estimate of the proportion of variability due to between studies variance. This is analogous to R-squared for true between studies variance, that is, it tells us the proportion of variance attributable to random effects. How much uncertainty do we have about this estimate?
Prediction or Credibility Intervals If the REVC is greater than zero, the true or underlying or infinite-sample effect sizes have a distribution, even after accounting for sampling error. The Prediction or Credibility Interval creates a range of values expected to contain a percentage (usually 95 percent) of the true effect sizes (assuming they are Normally distributed). Metafor will compute prediction/credibility intervals for you. Metafor uses z (1.96) for the computation of the prediction interval. If you want the Higgins version that uses t instead of z (to account for imprecision in the estimate of the REVC with small numbers of studies), you must compute it from information contained in the Metafor output. I ve written code you can use.
Higgins Prediction Intervals = + * 2 Bounds M t T V df * M Makes sense if random effects. M is the random effects mean (summary effect). The value of t is from the t table with your alpha and df equal to (k- 2) where k is the number of independent effect sizes (studies). T-square is the REVC, and the variance of the mean is the squared standard error of the RE summary effect (squared SEM). Metafor replaces the t(.975, df) with z=1.96 for the 95 percent PI. Borenstein, M., Hedges, L. V., Higgins, J. P. T., & Rothstein, H. R. (2009). Introduction to meta-analysis (p. 129, equation 17.7). Chichester, UK: Wiley.
R code: McNatt data (Pygmalion studies) McDaniel data (predictive validity of the interview for job performance)