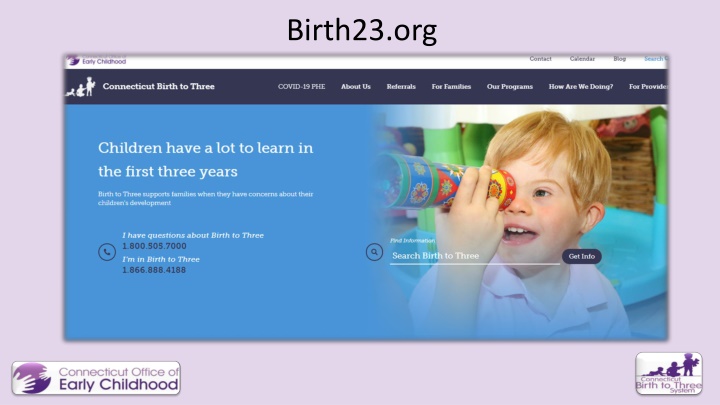
Discover Connecticut's Birth to Three system, offering Early Intervention Services and support programs for families to enhance child development and community connections. Explore the timeline, budget projections, service changes, and agency shifts within the program.
Please find below an Image/Link to download the presentation.
The content on the website is provided AS IS for your information and personal use only. It may not be sold, licensed, or shared on other websites without obtaining consent from the author. If you encounter any issues during the download, it is possible that the publisher has removed the file from their server.
You are allowed to download the files provided on this website for personal or commercial use, subject to the condition that they are used lawfully. All files are the property of their respective owners.
The content on the website is provided AS IS for your information and personal use only. It may not be sold, licensed, or shared on other websites without obtaining consent from the author.
CT B23 System Timeline and ASD 2007 Autism Specific Programs 1998 2003 2017-18 Converted to FFS Began Family Cost Participation 1st Autism Guidelines 1993 ICD10 2016 Change in Lead Agency 2011 Three State-wide RFPs 2002 2005 Hearing Requiring ABA 2020 One 1996 Change in Lead Agency 36.2 Hours Mediation Agreement State-wide RFP Deficits Every Year
From Bundled Rates to Fee for Service Before After Commercial Insurance Medicaid Much less Medicaid Different rates by type of program Different contracts More Medicaid revenue Same rates for all EIS More skin in the game Better productivity OEC Payments to Programs
FY19-20 RFP Before After 27 6 3 16 Programs x Type Autism Specific DHH Specific General 19 11 2 6 EIS Programs in Total Specialize in ASD Specialize in DHH No specialty (yet) 3 of the agencies that ran autism specific programs also ran general programs The agencies that used to run two programs only run one Comprehensive EIS program
Early Intervention Supports Provided Each Month by R/E and Method* Counts of All Children Percent in Month January In-Person Remote In-Person Remote In-Person Remote 13% 87% 16% 12% 88% 15% 13% 87% 14% 15% 85% 17% 10% 90% 14% January 2021 In-Person Remote Total In-Person Remote Total In-Person Remote Total 816 5272 6088 1013 5343 261 1828 2089 316 1836 95 636 731 109 426 2488 2914 531 2524 34 320 354 57 February 2021 March 2021 February March R/E group All Hispanic Black Non-Hispanic White Non-Hispanic Other Non-Hispanic R/E group All Hispanic Black Non-Hispanic White Non-Hispanic Other Non-Hispanic 6356 2152 755 3055 394 1584 490 169 834 91 5506 1888 681 2591 346 7090 2378 850 3425 437 84% 85% 86% 83% 86% 22% 21% 20% 24% 21% 78% 79% 80% 76% 79% 646 337 Counts of Children with an Autism Spectrum Disorder January 2021 In-Person Remote Total In-Person Remote Total In-Person Remote Total 167 685 852 183 71 285 356 76 27 95 122 20 58 256 314 72 11 49 60 15 *Children whose families received both methods in the month are counted in both columns. Percent in Month January In-Person Remote In-Person Remote In-Person Remote 20% 80% 22% 20% 80% 22% 22% 78% 17% 18% 82% 23% 18% 82% 25% February 2021 March 2021 February March R/E group All Hispanic Black Non-Hispanic White Non-Hispanic Other Non-Hispanic R/E group All Hispanic Black Non-Hispanic White Non-Hispanic Other Non-Hispanic 653 271 99 237 46 836 347 119 309 61 237 84 32 99 22 615 264 88 218 45 852 348 120 317 67 78% 78% 83% 77% 75% 28% 24% 27% 31% 33% 72% 76% 73% 69% 67% ALL ASD DPH 2017 25% 13% 54% 8% Percent of Totals Hispanic Black Non-Hispanic White Non-Hispanic Other Non-Hispanic Jan 34% 12% 48% 6% Feb 34% 12% 48% 6% Mar 34% 12% 48% 6% Jan 42% 14% 37% 7% Feb 42% 14% 37% 7% Mar 41% 14% 37% 8% Births Hispanic Black Non-Hispanic White Non-Hispanic Other Non-Hispanic 2016 24% 13% 55% 8% 2018 25% 14% 54% 7%
Transition Out of Part C Part C - Birth to Three Part B - Preschool Special Education Natural Learning Environments Naturalistic Interventions Least Restrictive Environment Family is the Focus for Coaching Education of the Child Home and Community Settings Peers in an Early Childhood Classroom OEC Birth to Three Autism Community of Practice Meeting every other month Referring families to Beacon before age 3 Sharing options with families about supports beyond what LEAs offer State Interagency Coordinating Council public comment Upcoming joint Early Childhood Intervention (ECI) convening with leaders in CT about the fluidity of a DSM diagnosis during preschool years


")


![ANC Women's League Oral Submission on Expropriation Bill [B23.2020]](/thumb/136076/anc-women-s-league-oral-submission-on-expropriation-bill-b23-2020.jpg)