Cyclus.js: Streamlining Analysis Workflow with Distributed Services and Visualizations
Cyclist and Cyclus are Java-based desktop applications that focus on computational steering, data input, scenario execution, and visual analytics for the Cyclus eco-system. Cyclist enables easy authoring of scenarios and decouples the simulation engine from visualization. It offers features like drag-and-drop interactions, local and global filtering, automatic charts, and extends the Simulation engine, Scenario Authoring, and Visualization capabilities. Cyclus.js further enhances the workflow by providing distributed services, data storage, script analytics, and state-of-the-art visualizations. It simplifies data manipulation and representation, supports various scripting languages and enriched fuel cycle metric library. The applications target efficient data management, computation, and visualization for better insights and decision-making in the domain.

Download Presentation

Please find below an Image/Link to download the presentation.
The content on the website is provided AS IS for your information and personal use only. It may not be sold, licensed, or shared on other websites without obtaining consent from the author.If you encounter any issues during the download, it is possible that the publisher has removed the file from their server.
You are allowed to download the files provided on this website for personal or commercial use, subject to the condition that they are used lawfully. All files are the property of their respective owners.
The content on the website is provided AS IS for your information and personal use only. It may not be sold, licensed, or shared on other websites without obtaining consent from the author.
E N D
Presentation Transcript
From Cyclist to Cyclus.js From Cyclist to Cyclus.js Cyclus user interfaces Cyclus user interfaces Yarden Livnat, University of Utah Anthony Scopatz, University of South Carolina Valerio Pascucci, University of Utah Paul Wilson, University of Wisconsin-Madison
Cyclist Cyclist A Java-based desktop application (part of the Cyclus eco-system) Computational steering input Data Cyclus Scenario exec vis Cyclist Scenario Authoring (Cycic) Simple remote Cyclus executions Visual analytics authoring Decouple the Simulation engine from scenarioAuthoring and Visualization
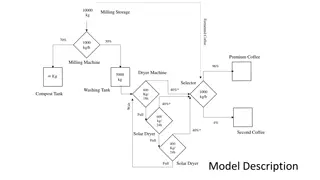
Cyclist Cyclist visualization Focus on Cyclus database tables Drag n drop interactions simulations jobs tables table fields workspace views authoring
Cyclist Cyclist visualization Local and global filtering Coordinated multiple views Automatic charts
Cyclist A Java-based desktop application Cyclus.js rename, upgrade, expand
Cyclus.js Cyclus.js Streamlining the analysis workflow Distributed services and capabilities Extendable scripted analytics Web-based state-of-the-art visualizations
Cyclus.js Cyclus.jsdistributed services Cyclus management services Data storage services Post-processing services Deploy your own or use ERGS public services
Cyclus.js Cyclus.js analytics Server side computation Jupyter based back-end Scripting capabilities Open architecture: Python, SQL, R, Matplotlib, Widgets Data representation as first-class objects e.g. time series, material flow, composition Simplify data manipulation and visualization Extensible fuel cycle metrics library
Cyclus.js Cyclus.js web-based visual analytics HTML/JavaScript/d3 Views: tables, advanced plots, graphs, geo-spatial, notebook (scripting), Jupyter widgets, SVG, printing, save and share, create your own Perspectives (topic oriented views) - Material flow: transactions, - Energy: demand, capacity, production, - Economics: cost, schedule, transition, - Political: stockpiles,
Cyclus.js Cyclus.js discussion session tomorrow 4-5pm Tell us what questions are you trying to answer? your pain points are? kind of analysis do you do? visualizations you use, need or wish you had? Your input, your tool Your input, your tool