Demography: Factors Affecting Populations
Explore the study of demography, focusing on population characteristics, such as size and age. Learn about factors like births, deaths, emigration, and immigration shaping population dynamics over time. Discover how societal changes, public policies, and individual choices impact birth rates and family structures. Delve into the effects of aging populations, migration trends, and historical shifts influencing population demographics.

Download Presentation

Please find below an Image/Link to download the presentation.
The content on the website is provided AS IS for your information and personal use only. It may not be sold, licensed, or shared on other websites without obtaining consent from the author. If you encounter any issues during the download, it is possible that the publisher has removed the file from their server.
You are allowed to download the files provided on this website for personal or commercial use, subject to the condition that they are used lawfully. All files are the property of their respective owners.
The content on the website is provided AS IS for your information and personal use only. It may not be sold, licensed, or shared on other websites without obtaining consent from the author.
E N D
Presentation Transcript
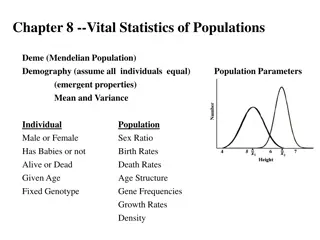
Demography The study of populations and their characteristics Characteristics include; size age Factors most directly affecting the size of the population are Births Deaths Emigration immigration
Smaller families = women go out to work =dual earner, symmetrical families Reduces burden of dependency =the number of live births per 1000 of the population Birth rate fallen from 28.7 in 1900 to 10.7 in 2007 Effects of changes Public services and policies Birth rate e.g. equality laws, contraception etc. mean there are other options Quantity to quality But...3 baby booms Child Changes in the position of women After WW1 and after WW2 centeredness Births 1960s =the average no. of children women will have during their fertile years Reasons for decline in BR It affects the birth rate Children an economic liability Decline in IMR Total fertility rate =Infant mortality rate Laws banned children from working, social norms about what children have a right to materially But...at first, smaller families not in areas where IMR declined Improved sanitation, housing medicine, nutrition, knowledge Risen since 2001 but lower than in the past Women remaining childless Having children later...less fertile
One-person households 1900 DR =19, 2007 = 10 Dependency ratio...BUT... Public services = no. of deaths per year per 1000 of the population Ageing Population Its declining effects Policy e.g. pensions Death rate Increased life expectancy; increased by two years per decade but still gender, class and regional differences Rose 1930- 1945 due to war Rose 1918 due to flu epidemic Deaths Other social changes decline in dangerous jobs e.g. mining Better wages = healthy lifestyle Better knowledge = better prevention less infectious diseases; Tranter: of the decline until 1970 due to e.g. smallpox....most significant amongst young Improved nutrition; McKeowen Led to increased resistance to infection. But women have less food but live longer and death from measles rose Public health and environmental improvements Gov. passed laws to improve better housing, Clean Air act reduced pollution, pasteurization of milk, purer drinking water reasons Medical Improvements; After 1950s antibiotics, immunisation, NHS, operations
Indust.Rev...shift from South to North Most migrants of working age so should reduce DR Recently...pull factors to South =the movement of people from place to place Internal Dependency ratio Immigration = into What? But...immigrant women have higher fertility rates...more children...increases DR Emigration = out Net Migration = diff. between no s immigrating and emigrating Migration Both immigrants and emigrants generally young...study/work From 1900-WW2, largest immigrant group were Irish and Jewish 2004 net migration of 223,000....EU expanded 1950s black and Asian, producing ethnically diverse society...2001 7.9% ethnic minority patterns Commonwealth countries offered assisted passage schemes More emigrated from UK then immigrated into it....most UK emigrants to USA, Australia, Canada Push factors reasons for moving away (e.g. recession) Pull factors moving to gain something (e.g. higher wages elsewhere)