Detect Small Shifts: CUSUM Chart
"Learn when to use the CUSUM Chart to detect small shifts in process mean, its sensitivity advantages over Shewhart control charts, and how to utilize it effectively in EngineRoom for statistical process control analysis. Follow step-by-step examples for practical application and interpretation."

Download Presentation

Please find below an Image/Link to download the presentation.
The content on the website is provided AS IS for your information and personal use only. It may not be sold, licensed, or shared on other websites without obtaining consent from the author. If you encounter any issues during the download, it is possible that the publisher has removed the file from their server.
You are allowed to download the files provided on this website for personal or commercial use, subject to the condition that they are used lawfully. All files are the property of their respective owners.
The content on the website is provided AS IS for your information and personal use only. It may not be sold, licensed, or shared on other websites without obtaining consent from the author.
E N D
Presentation Transcript
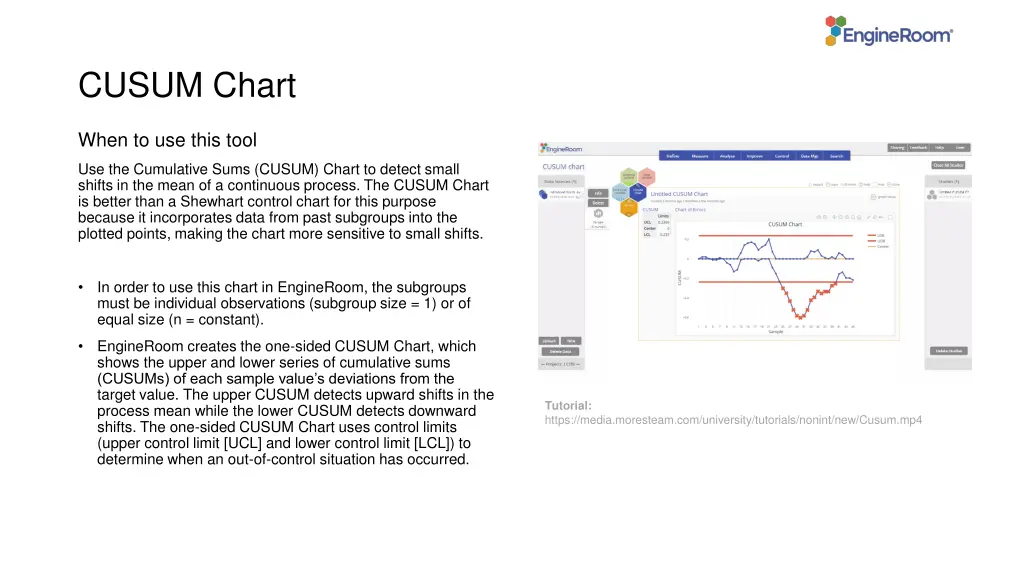
CUSUM Chart When to use this tool Use the Cumulative Sums (CUSUM) Chart to detect small shifts in the mean of a continuous process. The CUSUM Chart is better than a Shewhart control chart for this purpose because it incorporates data from past subgroups into the plotted points, making the chart more sensitive to small shifts. In order to use this chart in EngineRoom, the subgroups must be individual observations (subgroup size = 1) or of equal size (n = constant). EngineRoom creates the one-sided CUSUM Chart, which shows the upper and lower series of cumulative sums (CUSUMs) of each sample value s deviations from the target value. The upper CUSUM detects upward shifts in the process mean while the lower CUSUM detects downward shifts. The one-sided CUSUM Chart uses control limits (upper control limit [UCL] and lower control limit [LCL]) to determine when an out-of-control situation has occurred. Tutorial: https://media.moresteam.com/university/tutorials/nonint/new/Cusum.mp4 Tutorial: https://media.moresteam.com/university/tutorials/nonint/new/Cusum.mp4
Using EngineRoom Measure > Control Charts (SPC) > CUSUM Chart
Using EngineRoom To use the CUSUM Chart, collect observations on at least 20 individual units or 20 subgroups over time. There are four drop zones attached to the study: Data Variable (required): For the measurement data variable. This variable must be numeric. Subgroup Variable: For the variable containing the subgroup IDs. If you don't have a subgroup variable, you can ignore this drop zone and simply enter the constant size in the dialog box provided. This variable can be numeric or text. Time Order Variable (optional): Use if you have a variable containing the time stamps for the subgroups. This variable can be numeric or date/time. Stage Variable (optional): Use if you have a variable identifying different stages (such as before and after an improvement initiative). This variable can be numeric, text, or date/time.
CUSUM Chart Example advancedcharts_exampledata_errors.xlsx advancedcharts_exampledata_errors.xlsx The data set provided contains a column (Errors) containing the difference of 45 daily measurements of groundwater effluent concentrations compared with the standard. Click on the data file in the data sources panel and drag Errors onto the Data Variable drop zone. Enter the value 1 in the dialog screen s Subgroup Size box. Click Continue. Enter the Target = 2, Decision Interval (h) = 6, and Shift Parameter (k) = 0.5. Click Continue. On the next screen Options menu, leave the Standard Deviation (Optional) box blank. Click Continue.