Developing Costing Models for Government Policies
Learn how to use Excel-based models to cost government policies and programs effectively. Explore the process of costing, evaluation of costing models, and development of your own model. Understand the importance of costing in decision-making for bridges and social policies.
Download Presentation

Please find below an Image/Link to download the presentation.
The content on the website is provided AS IS for your information and personal use only. It may not be sold, licensed, or shared on other websites without obtaining consent from the author. If you encounter any issues during the download, it is possible that the publisher has removed the file from their server.
You are allowed to download the files provided on this website for personal or commercial use, subject to the condition that they are used lawfully. All files are the property of their respective owners.
The content on the website is provided AS IS for your information and personal use only. It may not be sold, licensed, or shared on other websites without obtaining consent from the author.
E N D
Presentation Transcript
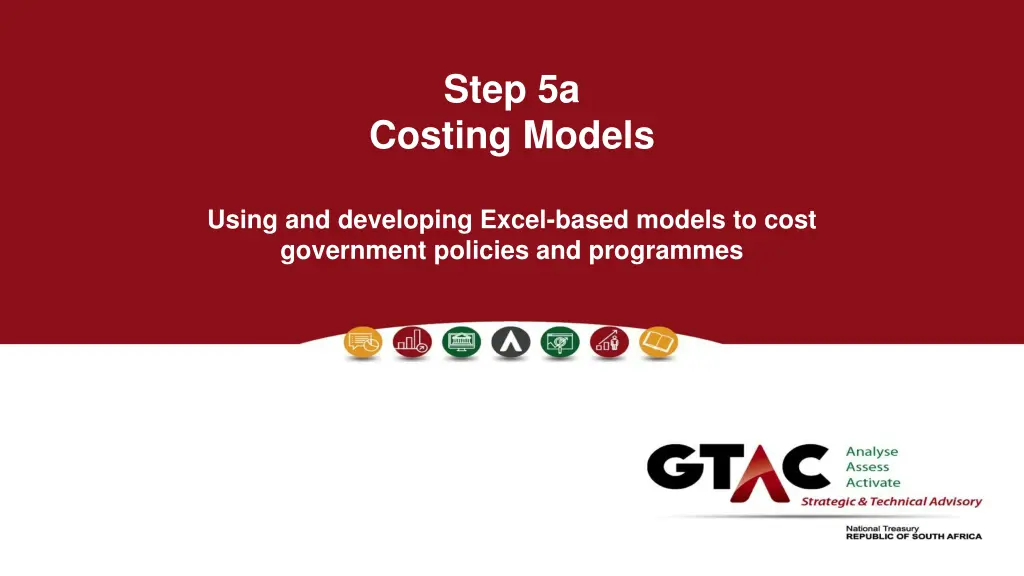
Step 5a Costing Models Using and developing Excel-based models to cost government policies and programmes
Spending Review Methodology What to expect, how will we work? Introduction & Savings Intro What is this implementation programme about? Institutional analysis Step 1 How does the programme work? Process maps and Logframes Step 2 How is it measured and how should it be measured? Indicators protocols Step 3 What are we spending on the programme? Expenditure Analysis Step 4 What does it actually cost to deliver the programme? Cost Modelling Step 5 What are our key messages? Where can we find savings? Report and Action Planning Step 6
1. Think of building a bridge list the different types of information you will require in order to work out the cost of building a bridge list the practical steps that are followed when working out the cost of building a bridge 2. Think of improving the in-service training of teachers list the different types of information you will require in order to work out the cost of improving in-service teacher training list the practical steps that are followed when working out the cost of improving in-service teacher training 3. Discuss why government generally works out the cost of building a bridge before making a decision, but rarely works out the cost of a social policy before making a decision? Exercise 5.1: What does costing government policy mean? 3
Learning outcomes By the end of this module, you should be able to: Understand what is costing and how to calculate costs Evaluate the quality of a costing model Use existing costing models to support your work Develop your own simple costing model 4
1. Again, think of building a bridge Describe what you understand by the word model in this context? What is the value of a model bridge? Exercise 5.2: What is a model? 2. Think of improving the in-service training of teachers What do you understand by the word model now? 3. Does a model need to be on a spreadsheet? 4. What are the advantages of building a model on a spreadsheet? 6
To use / build a costing model, you will need to have PREREQUISITES 7
Prerequisites - Institutional analysis Process maps or flow charts Can you draw a picture of how activities link together so you can present this logically in an Excel model? Do you understand how different processes tie role-players together? Flow of funds Do you understand the intergovernmental financial relations and budgets in government with respect to the programme? Can you map spending to spheres of government, departments and entities and Votes, budget programmes and sub-programmes? 8
Prerequisites Programme logic analysis Logical framework - do you understand: the key programme elements involved in the delivery of the programme? the delivery chain linking inputs to activities to outputs? the cost-drivers? factors affecting demand for services, supply of inputs and how inputs becomes outputs how demand for the programme is measured? The key policy questions the model needs to answer Do you have a good sense of the what if questions with regards to existing processes? 9
Prerequisites Key performance indicators Access to information Do you have a good knowledge of where to find: census data administrative data for health, education etc. performance data Norms and standards that apply to the programme Both explicit and implicit? How do norms and standards describe the relationships between demand, inputs and outputs? Information comes from legislation, international agreements, regulations, strategic plans, management protocols and from the heads of practitioners 10
Prerequisites Expenditure analysis Expenditure analysis of the programmes Do you understand the structure of expenditure? What types of expenditure are significant and therefore need to be modelled explicitly? What are the relationships between different types of costs? Can some costs be modelled as proportions of others? What are those proportions? 11
Preparing to use / build a costing model Market prices Actual service delivery Costing model Processes, activities and inputs Non-government funding Programme logic analysis Expenditure analysis Norms and Standards Price Govt price standards Regulations Institutional structure Govt Accounts Demand Expenditure reports Legislation Institutional analysis Key performance indicators Key policy questions ? Performance information Policy Demographic and Administrative Data Powers and Functions Assigned (usually in a Constitution) 12
Whats in a costing model? Costing is the process of using the following equation to estimate total programme costs = x x Cost Input Price Quantity This equation is used in many different forms to estimate the cost of many layers and types of activities Each element of this equation will be discussed in detail 14
Costing an existing programme versus costing a new policy New policy The policy is often thin on implementation details need to speak to people in the field to find out how the policy is likely to be implemented look at other similar programmes Costing involves imagining what implementation will look like this requires a thorough understanding of the policy intent, the implementing institutions and how government programmes are structured Provide for set-up costs Very often policy is ambitious, so may need to model a full policy scenario a pragmatic scenario a rollout scenario Existingprogramme There is more information on: actual expenditures implementation systems, processes and procedures practical norms & standards Compare policy with the practice Costing involves modelling reality this can be a challenge since there is a baseline that the model needs to replicate Very often implementation does not reflect policy intent, so may need to model a current practice scenario a policy scenario a rollout scenario 15
Costing brings fiscal realities into policy discussions Policy often reflects ambitious, idealistic best practice scope of the policy norms and standards coverage of intended beneficiaries objectives are laudable, but not fiscally affordable or sustainable A costing model explores the fiscal implications of policy identify pragmatic options that are more affordable and sustainable. moderating the scope of the policy reducing the norms and standards from best to good practice restricting the eligible beneficiaries to those most in need construct the costing model so that the implications of these changes can be explored 16
1. Develop a costing (budget) for a party you are organising. Exercise 5.3: Application of the costing equation 2. Reflect on the steps you followed in developing this costing, and list them in a logical order. 3. If your party has to be postponed by a year, how will that affect your costing? 4. If you are told that the budget for your party is only sufficient to cover 75% of your original costing, what are you going to do? 17
x Input Price DEFINING INPUTS AND PRICES 18
Every input has price However, you need to decide which inputs to count Defining inputs and prices Identify key activities and inputs - 80/20 Principle Understand the nature of different inputs/costs capital versus operating inputs/costs set-up versus ongoing inputs/costs fixed versus variable inputs/costs direct versus indirect inputs/costs inputs where TIME is a variable Because their nature determines how to cost them 19
Capital inputs Things that get capitalised in accrual accounting Buildings and facilities either based on detailed plans or standard building costs may not be taken into account if facilities exist usually part of the set-up costs of a programme how does one treat major renovations? Major capital equipment a ICU unit or a mobile clinic vehicles Operating inputs Things that get expensed in accrual accounting Personnel the largest input in most programmes Transport Programme specific inputs medicines textbooks Transfers to NPOs Capital versus operating inputs/costs 20
Set-up inputs/costs What is required to get a programme up and running? Ongoing inputs/costs What is required to keep a programme running? Set-up versus ongoing inputs/costs distinguish between ongoing costs and the impact of rollout Relevant to the costing of new services and the significant expansion of current services The estimated annual budget required to run the programme Show separately because of their non-recurrent nature Show cost for each year of the MTEF Examples? How do you treat price increases? Examples? 21
Variable inputs/costs There is a direct relationship with changes volume of output May be lumpy increase in a step-wise fashion as the volume of service increases vary according to seasonality, cycles or specific time periods for delivery Examples? Fixed inputs/costs Don t change in the short term despite changes in volume of output Change only when significant increases or decreases in volume occur Examples Fixed versus variable inputs/costs 22
Direct inputs/costs Inputs that are required for the delivery of the programme AND that are paid for by government i.e. it is a direct cost to government Apply the 80/20 principle Certain direct inputs may be treated as out-of-scope because of the focus of the costing model Indirect inputs/costs Inputs that contribute to the delivery of the programme, BUT that are not paid for by government Examples: Taxi fares to the clinic The opportunity cost of volunteers' time The imputed cost of in-kind contributions or existing infrastructure Not included unless doing an RIA or there is a particular policy question that needs to be answered Direct versus indirect inputs/costs Overhead expenses Costs of supervision and corporate services 23
Used to determine the required capacity of facilities and the required number of personnel e.g. time taken for an interview Inputs where TIME is a variable Important for determining the quality of service if there is a waiting period what happens in the interim e.g. if adoptions take 3 months for approval what happens to the child in the interim and what other costs are incurred during that period Responsiveness of early intervention measures certain actions are needed at a specific time, any delay detracts from the quality, usefulness of the service e.g. emergency medical services 24
Where does one find price information? Where to obtain prices? Historical accounting information Past purchase invoices Suppliers and retailers Employee time sheets Employee pay roll or DPSA salary scales Need to check that prices are current prices May need to adjust for inflation May need to adjust for escalation or term agreements For certain imported inputs, the exchange rate may be important 25
Go to the GenAssumptions sheet in the INSET Costing Model and analyse the Course Assumptions from line 33 down 1. List 10 different inputs that have been included in the costing of INSET courses 2. Can you think of any additional inputs related to INSET courses that should have been included? 3. Discuss how time has been factored into the costing of INSET courses 4. Identify three other instances where a time variable is costed in the INSET model, and note how it is costed 5. How is Infrastructure costed in the INSET Model 6. Why is the costing of courses placed on the GenAssumption sheet? Exercise 5.4: How does one model different inputs? 26
Quantity ESTIMATING DEMAND FOR SERVICES 27
Who are the intended clients or beneficiaries? How are they identified? Is the programme designed to reach a specific sub- group? Where is demand for each service located? What impact does the location of demand have on costing? What is the current level of output? What is the required/desired level of output? Questions to ask when estimating the demand for services What is the relationship between demand, process variables and the different kinds of inputs? 28
How does the timing of demand impact on cost? Some services are needed immediately emergency removal of children from dangerous places emergency medical care Some services can have a lead time fostering and adoptions Some services can be delayed counseling, assessments or court processes How do these differences affect the cost of services? 29
Things you need to think about when considering demand When thinking about the demand for a service, consider: Number Volume Regularity/frequency Quality Time period One-off/continuous Relate the demand to How long do processes take? What are the expected waiting times? Who is involved? What resources get used? 30
Factors influencing demand Demographic factors Population profile, birth/mortality rates, poverty, migration Social factors Crime rates, gang-related activity, family structures Health factors HIV/Aids, TB Success or failure of policy If prevention is unsuccessful demand is higher If adoption policy is successful, the demand for care decreases 31
Sometimes estimating inputs is really complicated Children with SAM with complications Coverage of treatment of above prevalence Can you explain what is being done on this page? 9 493 100.0% 9 493 100.0% 9 493 100.0% 4 929 100.0% 2 180 100% SAM Without Complications Per cent of children in each category 10% 50% 32% 5% 3% 100% SAM With complications Per cent of children in each category 10% 50% 32% Median weight of child (kg) in category Median weight of child (kg) in category Category 1 Category 2 Category 3 Category 4 Category 5 4.0 6.0 9.0 12.0 14.0 4.0 6.0 9.0 12.0 14.0 5% 3% 100% Per cent of children given Number of Units/Dose Per Kg or per patient Regularity of dose Number of days Units Cost of medication and food stuffs per child admitted Category 1 Category 2 Category 3 Category 4 Category 5 Severe Acute Malnutrution - with medical complications, Stabilisation phase Feeding and nutrition F 75 F 100 Vitamin A 100 000 IU Vitamin A 200 000 IU Antibiotics and medical treatment Metronidazole Ampicilin Gentamicin Ceftriaxone Oral amoxycillin Mebendazole Oral Rehydration Salts Modified ringers lactate IV Glucose ARV Treatment (see PDOH for whether this is included in costing) 4 6 9 12 14 100% 100% 30% 70% 100.0 200.0 1.0 1.0 Per kg Per kg 7 7 ml Per day R 259.42 R 389.13 R 583.70 R 778.26 R 907.97 ml Per day R 478.80 R 718.20 R 1 077.30 R 1 436.40 R 1 675.80 Capsule Per patient One off R 0.20 R 0.20 R 0.20 R 0.20 R 0.20 Capsule Per patient One off R 0.60 R 0.60 R 0.60 R 0.60 R 0.60 100% 100% 100% 100% 100% 50% 100% 100% 100% 30% 21.0 50.0 7.5 50.0 15.0 1.0 1.0 10.0 5.0 Per kg Per kg Per kg Per kg Per kg 7 7 7 7 7 mg Per day R 69.15 R 103.72 R 155.58 R 207.45 R 242.02 mg Per day R 10.28 R 15.41 R 23.12 R 30.83 R 35.97 mg Per day R 21.00 R 31.50 R 47.25 R 63.00 R 73.50 mg Per day R 6.68 R 10.02 R 15.03 R 20.03 R 23.37 mg Per day R 29.74 R 44.60 R 66.91 R 89.21 R 104.08 Tablet Per patient One off R 0.72 R 0.72 R 0.72 R 0.72 R 0.72 7 1 1 7 Sachet Per patient Per kg Per kg Per day R 21.91 R 21.91 R 21.91 R 21.91 R 21.91 ml Per day R 0.31 R 0.46 R 0.69 R 0.93 R 1.08 ml Per day R 0.23 R 0.34 R 0.51 R 0.68 R 0.79 32 Days R 8.05 R 8.05 R 8.05 R 8.05 R 8.05 R 907.07 R 1 344.87 R 2 001.56 R 2 658.26 R 3 096.06
With reference to the INSET Costing Model 1. What variables are used to estimate the demand for INSET courses? 2. Which variables would you regard to be the key drivers of demand? Where are they set? 3. What happens to costs if the number of training days teachers have to complete in a three year cycle increases to 45 days? 4. Suggest three pragmatic approaches to changing the demand for courses that would reduce costs? 5. How is the demand for infrastructure worked out in the INSET model? Exercise 5.5: Estimating demand 33
Summary tables should show the following The costing results Start-up costs Operating costs Capital costs Present breakdowns by main input items Present breakdown by main activity Supporting information on outputs Supporting information on key inputs Breakdown of personnel numbers Large capital items buildings, vehicles Other key inputs 35
Summary of costs by item Summary cost of program in local currency Real cost in 2014 units 2 010 2 417 866 76 932 - 158 749 1.221 1.171 1.056 Consumer Price Index ZAR Cost by item Personnel Training - delivery personnel Training - program beneficiaries Program resources Food and supplements Cash transfers Contracted supplier services Travel and accommodation Knowledge sharing External evaluation Equipment Administration (direct costs) Administration (indirect overheads) Own item name 1 Own item name 2 Own item name 3 Unallocated Total cost (excluding cost of buildings) Nominal cost 2 010 1 980 000 63 000 130 000 Total real cost in 2014 units 7 156 557 2 079 000 63 000 130 000 2 011 2 182 950 63 000 130 000 2 012 2 434 093 73 760 152 204 2 011 2 304 597 66 511 137 244 2 012 217 203 - - - - - - 448 197 100 000 12 800 192 000 2 483 800 - 268 800 201 600 2 773 400 - 268 800 211 680 2 887 430 - 122 114 15 631 234 460 3 033 079 - 314 711 236 033 3 247 097 - 283 779 223 476 3 048 335 - 9 328 511 - 25 000 25 000 29 270 26 393 177 778 614 121 20 686 6 000 - - - - - - - 6 000 - - - - - - - 6 000 - - - - - - - 7 327 - - - - - - - 7 025 - - - - - - - 6 334 - - - - - - - - - - - - - - 693 969 Buildings Building type 1 Building type 2 Building type 3 2 483 800 2 483 800 - - - - 2 773 400 2 773 400 - - - - 2 887 430 2 887 430 - - - - 3 033 079 3 033 079 - - - - 3 247 097 3 247 097 - - - - 3 048 335 3 048 335 - - - - 9 328 511 9 328 511 - - - - Total cost of buildings Total cost 36 Imputed costs - - - - - - - Total cost, including imputed costs
Summary of costs by main activity Summary cost of program in local currency Real cost in 2014 units 2 010 - - - - 3 033 079 - - - - 3 033 079 - 3 033 079 - 3 033 079 1.221 1.171 1.056 Consumer Price Index Nominal cost 2 010 2 483 800 2 483 800 2 483 800 2 483 800 Total real cost in 2014 units 9 328 511 9 328 511 9 328 511 9 328 511 Cost by main activity Design and start-up of program Management of program Training of trainers Community group meetings Home visiting Payment of cash transfers Template1 Template2 Template3 Total cost (excluding cost of buildings) New buildings required to deliver ECDN services 2 773 400 2 773 400 2 773 400 2 773 400 2 011 - - - - 2 887 430 2 887 430 2 887 430 2 887 430 2 012 - - - - 3 247 097 3 247 097 3 247 097 3 247 097 2 011 - - - - 3 048 335 3 048 335 3 048 335 3 048 335 2 012 - - - - - - - - - - - - - - - - - - - - - - - - - - - - - - - - - - - - - - - - - - Total cost Imputed cost of volunteers, donations, etc. Total cost, including imputed costs - - - - - - 37
Summary information on outputs and unit costs Delivery variables Notes Number of Items Items delivered Nature of item 2010 2011 2012 Total number of FCM visits in a year 6400 6400 6400 Notes Number of beneficiaries Beneficiaries 2010 2011 2012 Total number of families visited by FCMs 3200 3200 3200 Nominal cost 2 010 388.09 776.19 Real cost in 2014 units 2 010 473.92 947.84 Total real cost in 2014 units Unit cost analysis 2 011 433.34 866.69 2 012 451.16 902.32 2 011 507.36 1 014.72 2 012 476.30 952.60 Total number of FCM visits in a year Total number of families visited by FCMs 485.86 971.72 38
Comparison of costing outcome to budget baseline From the Nutrition Costing Model Preventative Interventions SROD and CSG Click on button to go to relevant section South Africa Health Headline Clinical Interventions ECD click here to change Overview of health budget Estimated Cost of Basic Service Package Budget Baseline New funds or cuts (-) 5 417 014 570 R 1 000 000 000 R R 56 000 Savings achieved 13% Cost savings that must be found Costs savings that must still be found -4 416 958 570 R 3 860 482 649 R 87% Savings still required Cost of service package based on changes below: 4 860 482 649 R Of which Compensation of Employees Non personnel expenditure 2 722 508 419 R 2 137 974 230 R 39
INSET Costing Model Using drop-down options Choose "Total Provinces" or the specific "province" Total Provinces Key policy parameters Click on buttons and choose from dropdown box Scenario 1 (with MTEF) Scenario 2 2014/15 Policy scenario 2014/15 2014/15 2015/16 2016/17 A No. of training days educators are required to complete in a three year cycle 30 30 30 30 30 The greater the number of training days educators are required to complete in a three-year cycle the higher the cost of INSET. However, the point of INSET is to upgrade educators teaching capacity so there is a trade-off between reducing the number of training days and likelihood of achieving the INSET outcomes The Pragmatic scenario baseline is set at 30 training days in a three year cycle. The greater the number of training days the more training infrastructure required. B Average participation rate of educators in INSET courses High qualified (degree +) Medium qualified (some academic qualification) Sub-standard 33% 33% 33% 33% 33% 33% 33% 33% 33% 33% 33% 33% 33% 33% 33% The Pragmatic scenario baseline is set at 33% participation in INSET. The more participate in INSET the more infrastructure required 41
Nutrition Costing Model Setting values in relation to bar graph Clinical Health Interventions 94 930 - Growth Faltering Change treatment rate for: Current (%) Proposed (%) Costs added/saved Children added/excluded 379 720 - Children covered Children not growing well 100 80 R 131 473 958 94930 142 395 - Children excluded Moderate Acute Children added Children with moderate acute malnutrition (MAM) - 47 465 100 25 1 653 604 796 R 142395 Children uncovered 35 599 - Children with severe acute malnutrition (SAM) Severe Acute 100 25 R 631 531 621 35599 - 11 866 Options for changing ECD coverage Change ECD coverage: -204 635 Net Effect of changes Proposed (%) R 811 675 230 Starting (%) Quintile 1 80% 65 Children in ECD Centres Quintile 2 80% 65 204 635 Quintile 3 35% 35 Children covered Children excluded Children added Change age groups included in ECD: Under 24 Months 24 Months to 36 Months 36 Months to 48 Months 48 Months to 60 Months 60 Months to 72 Months Current No No Yes Yes Yes Proposed No No Yes Yes Yes Children uncovered 1 120 376 -183 315 42
NSFAS Costing Model Options in relation to a baseline 20 300 75 NSFAS Funding Requirements Number Graduates NSFAS Produced Number of Students Funded by NSFAS Rand Billions Thousands of Students Thousands of Graduates 18 65 260 16 55 14 220 12 45 10 180 35 8 140 6 25 4 100 15 2 Baseline Baseline Baseline - 60 5 Per cent of enrolled students awarded loans Universities Base African 40% Coloured 18% Indian 4% White 1.0% These are first entrant students Value of Loans Drop out Rates 2010-2019 Base 25% 8% 6% 4% Loan Conversions Cost of study cap Base Average Allocation New Average Allocation 67 400 46 000 46 000 2020-2030 Base 10% 3% 2% 2% Year Unisa Per cent of students that get 20 % of their loans converted 40 % of their loans converted Bursaries awarded to students passing final year Note: % for 3rd years above is applied to 4th, 5th and 6th year New 55.0% 18.0% 4.0% 1.0% Base 25% 13% 2% 0% New 25.0% 12.5% 2.0% 0.3% New 25% 8% 6% 4% New 10% 3% 2% 2% 1st 30% 65% 2nd 30% 65% 3rd 30% 65% 100% 100% Base 30% 65% First Year Second Year Third Year Fourth Year Repayment Rates Base (2014) New Grads 16% 16% Drop-Outs 8% 8% 20 12 4 500 Total Value of NSFAS Awards Made Rand Billions Value of NSFAS Loan to Bursary Conversions Loan Repayments Made to NSFAS Rand Billions Rand Millions 18 4 000 10 16 3 500 14 8 3 000 12 2 500 10 6 2 000 8 4 1 500 6 1 000 4 2 Baseline 500 2 Baseline Baseline 0 0 0 43
Open the INSET Costing Model Totals and Scenarios 1. Identify the top three cost drivers of INSET. 2. Given the current budget constraints develop a scenario that you would recommend to MTEC for funding. Exercise 5.10: Exploring policy choices Open the Nutrition Costing Model Budget Choices sheet 1. Develop a scenario for the health component where expenditure equals the available budget of R1.5 billion. 2. What is your view of the resultant scenario in 1? 3. Develop a scenario for the health component that you would recommend to MTEC for funding. Open the NSFAS Choices Model 1. Using the model to identify interventions that would improve the financial viability of the NSFAS scheme 44
Technical tips - 1 Learn how to use the following Excel functions: INDEX MATCH V/HLOOKUP IF SUMIF SUMPRODUCT Drop down menus (Data validation/Lists) Group function Think about the above when ideas swirl in your head Conditional formatting has its merits, but keep it simple 46
Technical tips - 2 Keep the design structure aligned across sheets so you can use shortcut drag / copy and paste functions Avoid macros not enough people understand how to use them Avoid using cell names (named cells) they reduce the transparency and traceability of formulae they create problems when sheets are copied into a workbook 47
Thank you 48

