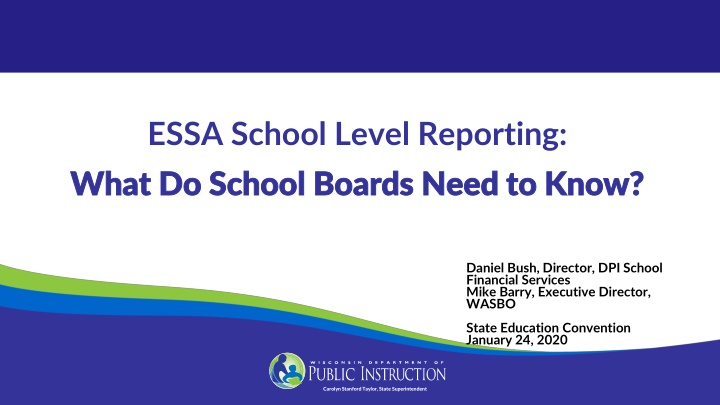
ESSA School Level Reporting: What School Boards Need to Know
The impact of ESSA on school funding, accountability, and reporting requirements. Learn about per-pupil expenditure reporting and the responsibilities of school boards and education departments. Discover the goals and benefits of school level reporting in promoting financial transparency and equity for students."
Download Presentation

Please find below an Image/Link to download the presentation.
The content on the website is provided AS IS for your information and personal use only. It may not be sold, licensed, or shared on other websites without obtaining consent from the author.If you encounter any issues during the download, it is possible that the publisher has removed the file from their server.
You are allowed to download the files provided on this website for personal or commercial use, subject to the condition that they are used lawfully. All files are the property of their respective owners.
The content on the website is provided AS IS for your information and personal use only. It may not be sold, licensed, or shared on other websites without obtaining consent from the author.
E N D
Presentation Transcript
ESSA School Level Reporting: What Do School Boards Need to Know? What Do School Boards Need to Know? Daniel Bush, Director, DPI School Financial Services Mike Barry, Executive Director, WASBO State Education Convention January 24, 2020 Carolyn Stanford Taylor, State Superintendent
Background Background 1965: Elementary & Secondary Education Act establishes how the federal government funds education in the states 2001: No Child Left Behind (NCLB) ties federal funding to accountability by student group 2015: Every Student Succeeds Act (ESSA) replaces NCLB 2
Every Student Succeeds Act (ESSA) Every Student Succeeds Act (ESSA) Reverses a trend toward greater federal control States in charge of accountability Focuses on state plans and reporting requirements Source: Libby Nelson, Congress is getting rid of No Child Left Behind. Here s what will replace it. Vox.com, Dec. 9, 2015, https://www.vox.com/policy-and-politics/2015/12/2/9836014/every-student-succeeds-act. 3
ESSA Title I, Section 1111 ESSA Title I, Section 1111 [State reporting shall include] the per-pupil expenditures of Federal, State, and local funds, including actual personnel expenditures and actual nonpersonnel expenditures of Federal, State, and local funds, disaggregated by source of funds, for each local educational agency and each school in the State for the preceding fiscal year. 4
So What Does That Mean? So What Does That Mean? Your responsibility Your responsibility: Report per-pupil federal & non-federal costs for each school to DPI Our responsibility Our responsibility: Collect this data and report it to the U.S. Department of Education 5
Why School Level Reporting? Why School Level Reporting? Goal Goal: Financial transparency of resource allocation on a per student basis Idea Idea: Use data to drive improvements and promote greater fairness and equity for all students 6
SLR Implementation Plan SLR Implementation Plan 2018-19 School Year Data Fall 2018: Report budget totals by school to DPI DONE! Late summer 2019: Report actuals by school to DPI DONE! June 2020: DPI reports audited actuals to U.S. Dept. of Education and publishes data to the public 7
SLR Implementation Plan SLR Implementation Plan 2019-20 School Year Data Fall 2019: Report budget totals by school to DPI DONE! Late summer 2020: Report actuals by school to DPI June 2021: DPI reports audited actuals to U.S. Dept. of Education and publishes data to the public 8
Basic Process Basic Process 1. Identify costs by 1 of 3 types 2. Identify costs by school or with the district/LEA as a whole 3. Report costs & enrollments to DPI 4. We do the per-pupil math 9
3 Types of Costs 3 Types of Costs 1. Federal: Costs funded with federal program dollars Does not include federal Impact Aid, which is basically a payment in lieu of taxes 10
3 Types of Costs 3 Types of Costs 2. State/Local: Costs funded with property taxes, state aids and grants, or other local sources (fees, gifts, interest, etc.) 11
Question and Answer Question and Answer Q: What about costs that aren t directly associated with educating your students year after year? A: Create exclusions to account A: Create exclusions to account for these for these 12
3 Types of Costs 3 Types of Costs 3. Exclusions: Costs your district/LEA can choose to exclude from your per-pupil amounts for each school 13
Exclusion Examples Exclusion Examples Debt Service Building & Other Capital Projects Food Service Community Programs and Services 14
Interstate Financial Interstate Financial Reporting Reporting Forward School District Forward School District Category Category Schurz El Phillips Mid Forward Hi A Enrollment 375 511 992 School Expenditures B Federal $456 $209 $164 DPI worked with 38 other states, over 20 districts, and experts at Georgetown University C State/Local $6,111 $4,756 $5,998 D School Per-Pupil Total $6,567 $4,965 $6,162 School Share of District/LEA Expenditures E Federal $161 $161 $161 Result was the Interstate Financial Reporting framework for School Level Reporting F State/Local $5,378 $5,378 $5,378 G District/LEA Per-Pupil Total $5,539 $5,539 $5,539 H Total Per-Pupil Expenditures $12,106 $10,504 $11,701 I Total School Expenditures $19,097,700 J Exclusions $2,416,986 K Total District Expenditures $21,514,686 Capital projects, community services, debt service, equipment, food service, interfund transfers, public choice tuition, trust funds L Excluded Expenditures 15 M Enrollment Count Procedure Third Friday of September headcount
Forward School District Forward School District Category Category Enrollment Enrollment Schurz El Phillips Mid Forward Hi A Enrollment 375 511 992 School Expenditures B Federal $456 $209 $164 Third Friday enrollment count C State/Local $6,111 $4,756 $5,998 D School Per-Pupil Total $6,567 $4,965 $6,162 Based who educates a student (headcount) rather than where they live (membership) School Share of District/LEA Expenditures E Federal $161 $161 $161 F State/Local $5,378 $5,378 $5,378 G District/LEA Per-Pupil Total $5,539 $5,539 $5,539 H Total Per-Pupil Expenditures $12,106 $10,504 $11,701 I Total School Expenditures $19,097,700 J Exclusions $2,416,986 K Total District Expenditures $21,514,686 Capital projects, community services, debt service, equipment, food service, interfund transfers, public choice tuition, trust funds L Excluded Expenditures 16 M Enrollment Count Procedure Third Friday of September headcount
Forward School District Forward School District Category Category School Expenditures School Expenditures Schurz El Phillips Mid Forward Hi A Enrollment 375 511 992 School Expenditures B Federal $456 $209 $164 Per-pupil amounts for teachers, support staff, supplies and other costs at the school level C State/Local $6,111 $4,756 $5,998 D School Per-Pupil Total $6,567 $4,965 $6,162 School Share of District/LEA Expenditures E Federal $161 $161 $161 F State/Local $5,378 $5,378 $5,378 G District/LEA Per-Pupil Total $5,539 $5,539 $5,539 Split by funding source into Federal and State/Local H Total Per-Pupil Expenditures $12,106 $10,504 $11,701 I Total School Expenditures $19,097,700 J Exclusions $2,416,986 K Total District Expenditures $21,514,686 Capital projects, community services, debt service, equipment, food service, interfund transfers, public choice tuition, trust funds L Excluded Expenditures 17 M Enrollment Count Procedure Third Friday of September headcount
District/LEA District/LEA Expenditures Expenditures Forward School District Forward School District Category Category Schurz El Phillips Mid Forward Hi A Enrollment 375 511 992 School Expenditures B Federal $456 $209 $164 Per-pupil amounts for administra- tion, central services, and other costs at the district/LEA level C State/Local $6,111 $4,756 $5,998 D School Per-Pupil Total $6,567 $4,965 $6,162 School Share of District/LEA Expenditures E Federal $161 $161 $161 Also split by funding source F State/Local $5,378 $5,378 $5,378 Divided by district/LEA enrollment will be the same numbers for every school G District/LEA Per-Pupil Total $5,539 $5,539 $5,539 H Total Per-Pupil Expenditures $12,106 $10,504 $11,701 I Total School Expenditures $19,097,700 J Exclusions $2,416,986 K Total District Expenditures $21,514,686 Capital projects, community services, debt service, equipment, food service, interfund transfers, public choice tuition, trust funds L Excluded Expenditures 18 M Enrollment Count Procedure Third Friday of September headcount
Total School Total School Expenditures Expenditures Forward School District Forward School District Category Category Schurz El Phillips Mid Forward Hi A Enrollment 375 511 992 School Expenditures B Federal $456 $209 $164 The per-pupil total for costs C State/Local $6,111 $4,756 $5,998 D School Per-Pupil Total $6,567 $4,965 $6,162 specific to each school School Share of District/LEA Expenditures Plus the district/LEA-wide per- E Federal $161 $161 $161 F State/Local $5,378 $5,378 $5,378 pupil total for costs at that level G District/LEA Per-Pupil Total $5,539 $5,539 $5,539 Equals per-pupil total school H Total Per-Pupil Expenditures $12,106 $10,504 $11,701 I Total School Expenditures $19,097,700 expenditures J Exclusions $2,416,986 K Total District Expenditures $21,514,686 Capital projects, community services, debt service, equipment, food service, interfund transfers, public choice tuition, trust funds L Excluded Expenditures 19 M Enrollment Count Procedure Third Friday of September headcount
Total School Total School Expenditures Expenditures Forward School District Forward School District Category Category Schurz El Phillips Mid Forward Hi A Enrollment 375 511 992 School Expenditures B Federal $456 $209 $164 This will be This will be the the number number C State/Local $6,111 $4,756 $5,998 D School Per-Pupil Total $6,567 $4,965 $6,162 people focus on and people focus on and use use School Share of District/LEA Expenditures E Federal $161 $161 $161 for for comparisons comparisons F State/Local $5,378 $5,378 $5,378 G District/LEA Per-Pupil Total $5,539 $5,539 $5,539 H Total Per-Pupil Expenditures $12,106 $10,504 $11,701 I Total School Expenditures $19,097,700 J Exclusions $2,416,986 K Total District Expenditures $21,514,686 Capital projects, community services, debt service, equipment, food service, interfund transfers, public choice tuition, trust funds L Excluded Expenditures 20 M Enrollment Count Procedure Third Friday of September headcount
Exclusions & Exclusions & Total Expenditures Total Expenditures Forward School District Forward School District Category Category Schurz El Phillips Mid Forward Hi A Enrollment 375 511 992 School Expenditures B Federal $456 $209 $164 These are district/LEA totals, not per-pupil numbers C State/Local $6,111 $4,756 $5,998 D School Per-Pupil Total $6,567 $4,965 $6,162 School Share of District/LEA Expenditures Also includes a list of all the exclusions being reported E Federal $161 $161 $161 F State/Local $5,378 $5,378 $5,378 G District/LEA Per-Pupil Total $5,539 $5,539 $5,539 H Total Per-Pupil Expenditures $12,106 $10,504 $11,701 I Total School Expenditures $19,097,700 J Exclusions $2,416,986 K Total District Expenditures $21,514,686 Capital projects, community services, debt service, equipment, food service, interfund transfers, public choice tuition, trust funds L Excluded Expenditures 21 M Enrollment Count Procedure Third Friday of September headcount
Talking About School Level Data Talking About School Level Data School level achievement data has been around for a long time School level finance data is a whole new dimension $12,608 per pupil 22
Talking About School Level Data Talking About School Level Data Dollar amounts aren t going on the Report Card yet But people will try to connect them once the data goes public $12,608 per pupil 23
Talking About School Level Data Talking About School Level Data How do you prepare for that conversation as board members? as administrators? $12,608 per pupil 24
Talking About School Level Data Talking About School Level Data Answer: Know Know Your Your School and School and Student Stories to Student Stories to Explain Explain Your Your Numbers Numbers $12,608 per pupil 25
Financial Transparency Fact #1 Financial Transparency Fact #1 Most school leaders do not have a good sense of the true financial resources allocated to specific schools in their districts/LEAs. Source: Edunomics Lab, Georgetown University. Financial transparency: What s your number? Presentation, Council of Chief State School Officers, 2017. 26
Financial Transparency Fact #1 Financial Transparency Fact #1 Why is this the case? How does your current budgeting process divide responsibilities? CLASSROOMS CURRICULUM STAFFING GRANTS INFRASTRUCTURE 27
Financial Transparency Fact #1 Financial Transparency Fact #1 School Level Reporting is a new requirement CLASSROOMS CURRICULUM But it s also an opportunity to bring more transparency and focus on students STAFFING GRANTS INFRASTRUCTURE 28
Financial Transparency Fact #2 Financial Transparency Fact #2 Most school leaders do not have a good sense of how well their schools are able to leverage dollars and maximize outcomes. Source: Edunomics Lab, Georgetown University. Financial transparency: What s your number? Presentation, Council of Chief State School Officers, 2017. 29
Financial Transparency Fact #2 Financial Transparency Fact #2 Are your budget initiatives improving learning and college & career readiness? How would you determine your return on investment? 30
How Might Someone Compare? How Might Someone Compare? School level per-pupil spending will be used to compare schools Already happening with 2018-19 budget reports What makes a valid comparison? 31
How Might Someone Compare? How Might Someone Compare? Dairyland Dairyland High Dairyland Dairyland High Dairyland Dairyland High Dairyland Dairyland High Dairyland Dairyland High Dairyland Dairyland High Dairyland Dairyland High High High High High High High High Whitetail High Whitetail High Whitetail High Whitetail High Whitetail High Whitetail High Whitetail High Whitetail High Whitetail High Whitetail High Whitetail High Whitetail High Whitetail High Whitetail High Per-Pupil Spending Per-Pupil Spending Per-Pupil Spending Per-Pupil Spending Per-Pupil Spending Per-Pupil Spending $15,622 $15,622 $15,622 $15,622 $15,622 $15,622 $12,096 $12,096 $12,096 $12,096 $12,096 $12,096 School Report Card School Report Card School Report Card School Report Card School Report Card Meets Exp. Meets Exp. Meets Exp. Meets Exp. Meets Expectations Exceeds Exp. Exceeds Exp. Exceeds Exp. Exceeds Exp. Exceeds Exp. Enrollment Enrollment Enrollment Enrollment 217 217 217 217 635 635 635 635 CESA CESA CESA 10 10 10 5 5 5 Title I Program? Title I Program? Yes Yes No No Health Insurance Traditional POS High Ded. HMO 32
How Might Someone Compare? How Might Someone Compare? Dairyland Dairyland High Dairyland Dairyland High High High Whitetail High Whitetail High Whitetail High Whitetail High Per-Pupil Spending $15,622 $12,096 School Report Card Meets Expectations Exceeds Exp. but this is all you re likely to see in the paper. It s up to YOU as leaders to add context. 33
Where is My Districts Report? Where is My District s Report? Today: 2018-19 annual reports are restricted to district users DPI doing data quality checks and following up with districts Ask your Administrative Team for it 34
What is DPI Doing? What is DPI Doing? Already done: Met with DPI s Parent Advisory Council Met with associations to review rollout plan Convened workgroup of staff with school & district experience to advise on technical assistance, messaging, and data presentation Engaged with CESA-based WISEexplore network 35
What is DPI Doing? What is DPI Doing? Now: Developing targeted technical assistance materials for Superintendents Principals Board Members Parents & Other Public Users 36
What is DPI Doing? What is DPI Doing? March: Secure data quality review for LEAs Release of technical assistance materials Targeted webinars 37
What is DPI Doing? What is DPI Doing? June: Data available to the public in WISEdash Reporting to U.S. Dept. of Education 38
A Real World Story A Real World Story Mike Barry, Current WASBO Executive Director and Former CFO, Madison Metropolitan School District 39
Your #1 Takeaway Your #1 Takeaway Total Per Total Per- -Pupil Expenditure Pupil Expenditure (Line H) is the critical data point (Line H) is the critical data point Know and share why each of your schools numbers are what they are Tell your school level stories Talk about your student successes! 40
Contact Contact Daniel Bush Daniel Bush Director DPI School Financial Services Team daniel.bush@dpi.wi.gov 608-266-6968 ESSA School Level Reporting webpage: https:// https://dpi.wi.gov/sfs/reporting/slr dpi.wi.gov/sfs/reporting/slr 41
Contact Contact Mike Barry Mike Barry Executive Director Wisconsin Association of School Business Officials (WASBO) Mike.Barry@wasbo.com 608-249-8588 www.wasbo.com 42
Questions? Comments? Questions? Comments? 43
