Explore the concept of point and interval estimates for population parameters such as mean, standard deviation, and proportion. Understand how point estimates provide single value approximations while confidence intervals give information about variability. Learn about the criteria of a good estimator and how to calculate point estimates for population mean and variance.
Please find below an Image/Link to download the presentation.
The content on the website is provided AS IS for your information and personal use only. It may not be sold, licensed, or shared on other websites without obtaining consent from the author. If you encounter any issues during the download, it is possible that the publisher has removed the file from their server.
You are allowed to download the files provided on this website for personal or commercial use, subject to the condition that they are used lawfully. All files are the property of their respective owners.
The content on the website is provided AS IS for your information and personal use only. It may not be sold, licensed, or shared on other websites without obtaining consent from the author.
E N D
Presentation Transcript
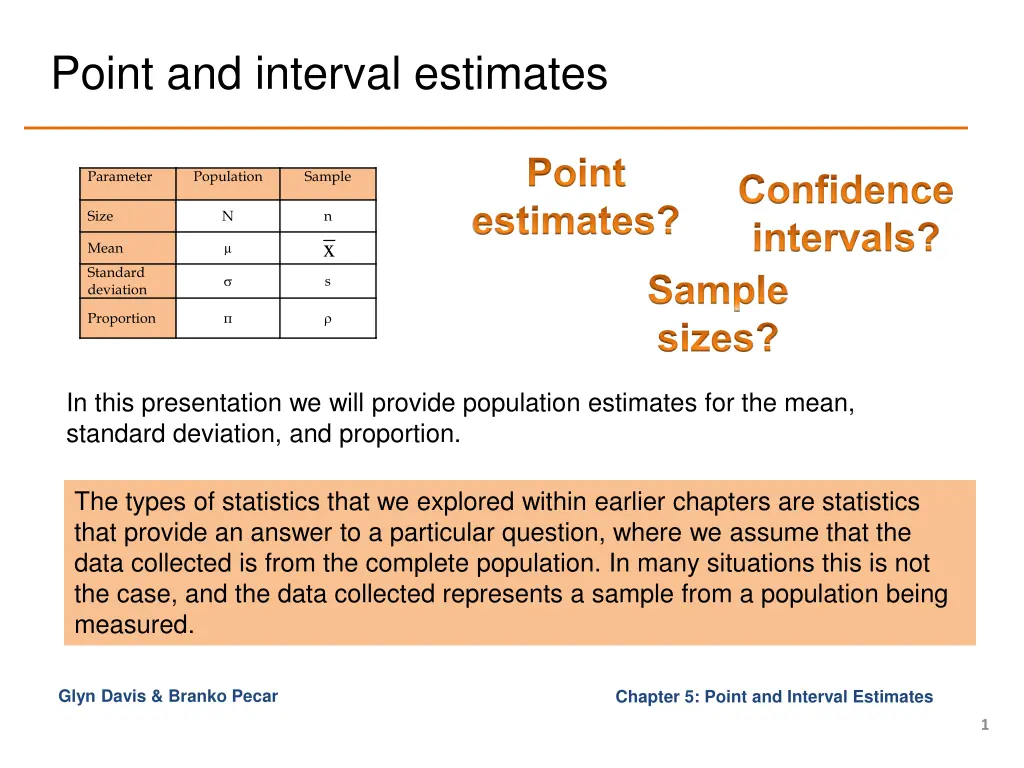
Point and interval estimates Point estimates? Confidence intervals? Sample sizes? Parameter Population Sample Size N n x Mean Standard deviation s Proportion In this presentation we will provide population estimates for the mean, standard deviation, and proportion. The types of statistics that we explored within earlier chapters are statistics that provide an answer to a particular question, where we assume that the data collected is from the complete population. In many situations this is not the case, and the data collected represents a sample from a population being measured. Glyn Davis & Branko Pecar Chapter 5: Point and Interval Estimates 1
Learning objectives On completing this unit you should be able to: Calculate point estimates for population parameters (mean, proportion, and variance) for one and two samples. Calculate sampling errors and confidence intervals when the population standard deviation is unknown (Student s t-test only. Determine sample sizes. Solve problems using Microsoft Excel and IBM SPSS. Glyn Davis & Branko Pecar Chapter 5: Point and Interval Estimates 2
Population Point Estimates In the previous section we explored the sampling distribution of the mean and proportion and stated that these distributions can be considered to be normal with particular population parameters ( , 2). For many populations, it is likely that we do not know the value of the population mean (or proportion). Fortunately, we can use the sample mean (or proportion) to provide an estimate of the population value. The objective of estimation is to determine the approximate value of a population parameter on the basis of a sample statistic. The method described in this section is dependent upon the sampling distribution being normally distributed (or approximately) and we can provide two estimates of the population value: point and interval estimate. A point estimate is a single number A confidence interval provides information about variability Glyn Davis & Branko Pecar Chapter 5: Point and Interval Estimates 3
Types of Estimate & Criteria of a Good Estimator A point estimate is a sample statistic that is used to estimate an unknown population parameter. An interval estimate is a range of values used to estimate a population parameter. It indicates error by the extent of its range and by the probability of the true population parameter lying within that range. Criteria of a good estimator: 1. Sample mean is an unbiased estimator of the population mean. 2. An unbiased estimator is consistent if the difference between the estimator and the parameter grows smaller as the sample size increases. 3. If we have two estimators of the parameter, then the one whose variance is smaller is said to be more efficient. It should be noted that the sample median has a greater variance than the sample mean - so we choose the sample mean rather than sample median. Glyn Davis & Branko Pecar Chapter 5: Point and Interval Estimates 4
Point Estimate of Population Mean and Variance A point estimator draws inferences about a population by estimating the value of an unknown parameter using a single point or data value. The sample mean is the best estimator of the population mean. It is unbiased, consistent, and the most efficient estimator. Unbiased estimate of population mean, : Unbiased estimate of population standard deviation, : = X ( ) 2 X - X = = s Standard error of the mean, : n - 1 X Use Excel function STDEV.S() to calculate s. s = = X n n Similar equations can be written for problems involving the calculation of point estimates: (i) proportions, (ii) pooling sample data from 2 samples. Glyn Davis & Branko Pecar Chapter 5: Point and Interval Estimates 5
Point estimates Example 5.1 An experiment was performed five times on the measurement of the length of rods with the following results: 1.010, 1.012, 1.008, 1.013 and 1.011. Calculate the unbiased estimates of the mean and variance of possible measurements and give an estimate for the standard error of the mean? The value of the unbiased estimates of the population mean, standard deviation, and standard error of the mean are provided by solving equations (5.3), (5.7), and (5.9). Glyn Davis & Branko Pecar Chapter 5: Point and Interval Estimates 6
Point estimates continued Sample values Population estimates Glyn Davis & Branko Pecar Chapter 5: Point and Interval Estimates 7
Excel solution (1/2) Method 1 Formula method equations 5.3, 5.5, 5.6 and 5.7 Glyn Davis & Branko Pecar Chapter 5: Point and Interval Estimates 8
Excel solution (2/2) Method 2 Excel function method Glyn Davis & Branko Pecar Chapter 5: Point and Interval Estimates 9
SPSS solution (1/4) Input data into SPSS (numbers listed to 2 dps) Frequencies method Select Analyze > Descriptive Statistics > Frequencies Switch off Display frequency tables (ignore warning) Transfer Sample_data_X into the Variable(s) box Glyn Davis & Branko Pecar Chapter 5: Point and Interval Estimates 10
SPSS solution (2/4) Click on Statistics Choose Mean, Std.deviation, S.E. mean SPSS output Click Continue Click OK Glyn Davis & Branko Pecar Chapter 5: Point and Interval Estimates 11
SPSS solution (3/4) Alternatively, you could use the SPSS Descriptives and Explore menus to provide the results. Select Analyze > Descriptive Statistics > Descriptives Transfer Sample_data_X into the Variable(s) box Click on Options Choose Mean, Std.deviation, S.E. mean Click Continue Click OK Descriptives method SPSS output Glyn Davis & Branko Pecar Chapter 5: Point and Interval Estimates 12
SPSS solution (4/4) Select Analyze > Descriptive Statistics > Explore Transfer Sample_data_X into the Dependent List box Click on Statistics Choose Descriptives Click Continue Click OK Explore method SPSS output Glyn Davis & Branko Pecar Chapter 5: Point and Interval Estimates 13
Population Confidence Intervals (CI) If we assume that the sampling distribution of the sample means are normally distributed then we can provide a measure of this error in terms of a probability value that the value of the population mean will lie within a specified interval - called an interval estimate (or confidence interval, CI), where the interval is centered at the point estimate for the population mean. We can re-arrange Equation (4.9) to given Equation (5.15): = X Z n For a 95% CI, Z= 1.96 = X 1.96 1 n = + X 1.96 2 n Glyn Davis & Branko Pecar Chapter 5: Point and Interval Estimates 14
CI Estimate for ( unknown, n < 30) In the previous example we calculated the point and interval estimates when the population was normally distributed but the population standard deviation was known. In most cases the population standard deviation would be an unknown value and we would have to use the sample value to estimate the population value with associated errors. The population mean estimate is still given by the value of the sample mean but what about the confidence interval? In the previous example the sample mean and size were used to provide this interval but in the new case we have an extra unknown, that as to be estimated from the sample data, to find this confidence interval. This is often the case in many student research projects. They handle small sizes and the population standard deviation is unknown. Glyn Davis & Branko Pecar Chapter 5: Point and Interval Estimates 15
Students t-distribution If we have a small sample and the population is unknown then we can use the Student s t distribution defined by equation (6.27) to estimate a confidence interval Assumptions: X = tdf s 1. Population standard deviation unknown 2. Population is normally distributed (or approximately) 3. Use large samples if population not normal n With the degrees of freedom is given by equation (5.19): The confidence interval is given by equation (5.20): Glyn Davis & Branko Pecar Chapter 5: Point and Interval Estimates 16
Properties of the t-distribution The t distribution is symmetric, like the normal distribution, but flatter. Figure 6.33 compares the t distribution with 5 degrees of freedom and the standard normal distribution. The t distribution is flatter than the normal distribution. Since the t distribution is flatter, the percentage of the distribution within 1.96 standard deviations of the mean is less than the 95% for the normal distribution. It should be noted that the t distribution Z distribution as n increases. Glyn Davis & Branko Pecar Chapter 5: Point and Interval Estimates 17
Example 5.4 (1/2) For the following sample of 8 observations from an infinite Normal population find the sample mean and standard deviation and hence determine the standard error, the population standard deviation and a 95% confidence interval for the mean: 10.3, 12.4, 11.6, 11.8, 12.6, 10.9, 11.2, and 10.3. The value of the critical t statistic at a significance level and degrees of freedom can be found from the Student s t distribution tables. For this data, we can calculate the summary statistics: Sample mean = 11.3875 Sample size, n = 8 Sample standard deviation, s = 0.8741322 ALPHA Df 1 2 3 4 5 6 7 8 50% 0.5 1.00 0.82 0.76 0.74 0.73 0.72 0.71 0.71 20% 0.20 3.08 1.89 1.64 1.53 1.48 1.44 1.41 1.40 10% 0.1 6.31 2.92 2.35 2.13 2.02 1.94 1.89 1.86 5% 0.05 2.50% 0.025 25.45 6.21 4.18 3.50 3.16 2.97 2.84 2.75 1% 0.01 12.71 4.30 3.18 2.78 2.57 2.45 2.36 2.31 63.66 9.92 5.84 4.60 4.03 3.71 3.50 3.36 From Table 5.4, the critical t value = 2.36 when P(T t) = 0.025 and 7 degrees of freedom. Glyn Davis & Branko Pecar Chapter 5: Point and Interval Estimates 18
Example 5.4 (2/2) We are 95% confident that, based on the sample, the true population mean is between 10.6567 and 12.1183 Glyn Davis & Branko Pecar Chapter 5: Point and Interval Estimates 19
Excel solution (1/2) Method 1 Excel formula method s = = X t 10.66 1 df n We are 95% confident that the population mean is contained within the interval 10.66 to 12.12. s = + = X t 12.12 2 df n Glyn Davis & Branko Pecar Chapter 5: Point and Interval Estimates 20
Excel solution (2/2) Method 2 Excel function method We are 95% confident that the population mean is contained within the interval 10.66 to 12.12. Glyn Davis & Branko Pecar Chapter 5: Point and Interval Estimates 21
SPSS solution using Explore (1/2) Enter data into SPSS Analyze > Descriptive Statistics > Explore Click on Statistics Choose Descriptives Click Continue Type 95 into the Confidence Interval for the Mean box Click OK Glyn Davis & Branko Pecar Chapter 5: Point and Interval Estimates 22
SPSS solution using Explore (2/2) Conclude, 95% confidence interval for the population mean using the Student s t distribution is: 10.6567 to 12.1183. This agrees with the Excel solution Glyn Davis & Branko Pecar Chapter 5: Point and Interval Estimates 23
Calculating sample sizes (1/3) We can control the width of the confidence interval by determining the sample size necessary to produce narrow intervals. For example, if we assume that we are sampling a mean from a population that is normally distributed then we can modify equation (5.21) to calculate an appropriate sample size using equation (5.24): (5.24) One way to look at equation (5.24) is to say that ? ? is in fact an interval within which our estimate should fall. In this case we can re-write the above equation as: (5.25) Glyn Davis & Branko Pecar Chapter 5: Point and Interval Estimates 24
Calculating sample sizes (2/3) Why number 2 in equation (5.25)? The graph in Figure 5.39 below illustrates the point. Another way to look at equation (5.24) is to say that ? ? is effectively an error (E) between estimated mean value and the true mean value. (5.26) Glyn Davis & Branko Pecar Chapter 5: Point and Interval Estimates 25
Calculating sample sizes (3/3) If ? ? is effectively an error E, we can now re-arrange equation (5.26) into: This gives the sample size n, as per equation (5.27): (5.27) Figure 5.40 illustrates the relationship between confidence interval, margin of error, and size of sample. Glyn Davis & Branko Pecar Chapter 5: Point and Interval Estimates 26
Example 5.7 A researcher requires to determine the sample size to be calculated with a margin of error of no more than 0.10 units of alcohol in total and with 98% confidence. Historical data provided to the researcher indicates that the population data is normally distributed with a population standard deviation of 0.2 units of alcohol. Information provided: 1. Population data normally distributed 2. Confidence interval = 98% 3. From table 5.3, Zcri for 98% CI = 2.326347874 4. Population standard deviation = 0.2 units 5. Required margin of error e = 0.05 units (=0.10/2) The sample size can now be calculated using equation (5.26). To meet the requirements of the researcher, a sample size of 87 is required. Glyn Davis & Branko Pecar Chapter 5: Point and Interval Estimates 27
Example 5.7 Excel solution Thus, to produce a 98% confidence interval estimate of the mean, we need a sample of 87. Glyn Davis & Branko Pecar Chapter 5: Point and Interval Estimates 28
Example 5.7 SPSS solution No SPSS solution Glyn Davis & Branko Pecar Chapter 5: Point and Interval Estimates 29
Conclusion In this presentation we explored the concept of a sampling data values from a population: Point estimates Confidence intervals Glyn Davis & Branko Pecar Chapter 5: Point and Interval Estimates 30


")
")
")
")
")
")
")
")


")
")
")
")
")
")
")
")
")