EU ETS Reform Overview: Assessing Trialogue Options 2021-2030
"Explore the position of the ENV Council and European Parliament on the EU ETS reform, including emissions projections, surplus market analysis, and proposed measures for the period 2021-2030. Contact experts at sandbag.org.uk for detailed insights."
Download Presentation

Please find below an Image/Link to download the presentation.
The content on the website is provided AS IS for your information and personal use only. It may not be sold, licensed, or shared on other websites without obtaining consent from the author. If you encounter any issues during the download, it is possible that the publisher has removed the file from their server.
You are allowed to download the files provided on this website for personal or commercial use, subject to the condition that they are used lawfully. All files are the property of their respective owners.
The content on the website is provided AS IS for your information and personal use only. It may not be sold, licensed, or shared on other websites without obtaining consent from the author.
E N D
Presentation Transcript
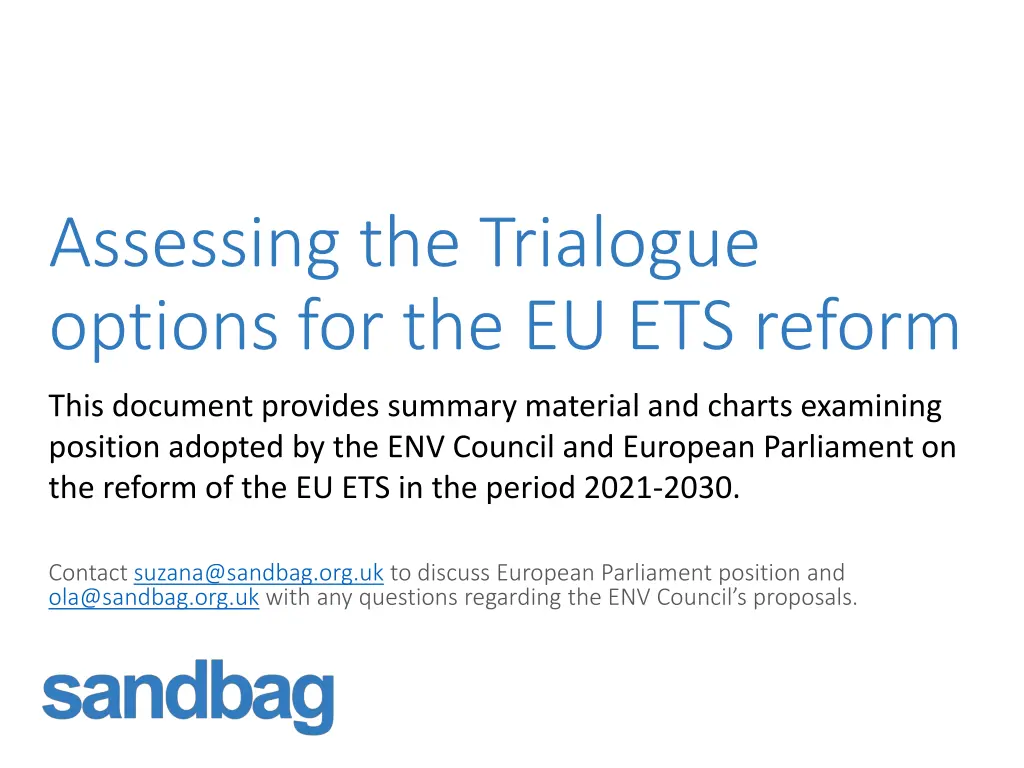
Assessing the Trialogue options for the EU ETS reform This document provides summary material and charts examining position adopted by the ENV Council and European Parliament on the reform of the EU ETS in the period 2021-2030. Contact suzana@sandbag.org.uk to discuss European Parliament position and ola@sandbag.org.uk with any questions regarding the ENV Council s proposals.
Emissions projections vs cap Emissions projections vs cap likely to remain below cap for most of 2020s for most of 2020s likely to remain below cap In 2015 ETS, 42% of EU ETS emissions from coal generation. Sandbag s base case emissions: Replacing all the coal capacity with gas, but replacing it with renewables delivers Sandbag s low case emissions. Welcome progress on emissions reductions; but the ETS needs to play a role. 3000 MtCO2e stationary installations 2013-2016 =-2.8% per year Sandbag Base = 1.2% per year Sandbag Low = 2.8% per year 2500 2000 1500 1000 500 0 Historic Emissions Sandbag Base Emissions ICIS BAU Emissions Exponential Trendline (Historic Emissions) Sandbag Low Emissions Reuters Emissions Cap 1
Base emissions, 2x MSR rate, General Approach Base emissions, 2x MSR rate, General Approach cancellation: 2030 surplus on the market 0.5Bt, and 637Mt cancellation: 2030 surplus on the market 0.5Bt, and 637Mt in the MSR in the MSR 4000 3000 2000 Mt CO2e 1000 0 -1000 -2000 -3000 GA MSR NewMSR Cancelled GA Surplus 2
Low emissions, 2x MSR rate, General Approach Low emissions, 2x MSR rate, General Approach cancellation: 2030 surplus on the market 2.1Bt and 428Mt cancellation: 2030 surplus on the market 2.1Bt and 428Mt in the MSR in the MSR 6000 4000 2000 Mt CO2e 0 -2000 -4000 GA MSR NewMSR Cancelled GA Surplus 3
EP proposal; Base emissions; 2x MSR rate; 800Mt EP proposal; Base emissions; 2x MSR rate; 800Mt cancelled: 2030 market surplus 448Mt, 2.8Bt in the MSR cancelled: 2030 market surplus 448Mt, 2.8Bt in the MSR 4000 3500 3000 Stationary installations, Mt 2500 2000 1500 1000 500 0 2008 2009 2010 2015 2016 2017 2021 2022 2023 2028 2029 2030 2011 2012 2013 2014 2018 2019 2020 2024 2025 2026 2027 -500 Cumulative surplus Historic Emissions Cumulative MSR Emissions Forecast Cap 4
EP proposal; Low emissions; 2x MSR rate; 800Mt EP proposal; Low emissions; 2x MSR rate; 800Mt cancelled: 2030 market surplus 2Bt, 4.5Bt in the MSR cancelled: 2030 market surplus 2Bt, 4.5Bt in the MSR 7000 6000 5000 Stationary installations, Mt 4000 3000 2000 1000 0 2008 2010 2012 2014 2017 2019 2021 2023 2025 2028 2030 2009 2011 2013 2015 2016 2018 2020 2022 2024 2026 2027 2029 -1000 Cumulative surplus Historic Emissions Cumulative MSR Emissions Forecast Cap 5
The relative difference of price effects of the different The relative difference of price effects of the different options that affect the surplus on the market options that affect the surplus on the market Doubling the MSR withdrawal rate initially reduces the surplus more quickly, but only 42 M tonnes difference in 2030. Cancellations from the MSR will only affect prices in the 2060s (EP) or 2030s at the earliest (Council) - the volumes returned are limited. Price Pricetrajectories: trajectories: This is not a forecast. The numbers reflect the expectation that a market clearing price of 30 would be the cost-effective price for abatement in the ETS. 6
Other options Other options can they improve the proposal? can they improve the proposal? Member States annual cancellation - impossible to foresee impact, likely insignificant unless Member States pledge to cancel their allowances; Potential LRF increase to 2.4% in 2024 as a part of post-Paris review, so overall a 2.3% LRF for the whole decade, an increase of a 0.1% - insignificant; Carryover of significant volume of allowances from Phase 3 (up to 470Mt under the Council proposal)instead of placing them in the MSR potentially significant and should be discouraged. How to ensure the impact of the reform is robust for How to ensure the impact of the reform is robust for effects of overlapping policies on real emissions? effects of overlapping policies on real emissions? Increase further the MSR intake rate and apply it throughout the Phase; Re-base the cap in line with real emissions at the end of Phase 3 and place the equivalent amount of allowances into the MSR. 7


![❤[PDF]⚡ Escaping from Eden: Does Genesis Teach that the Human Race was Created](/thumb/21697/pdf-escaping-from-eden-does-genesis-teach-that-the-human-race-was-created.jpg)
