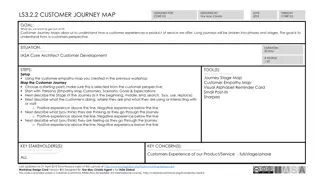
Exploring Customer Perceptions and Service Experience at ZWUC Treasury Department
"Discover the cognitive and affective perceptions of ZWUC treasury department clients through a customer experience survey. Gain insights into customer service drivers, inhibitors, and solutions for enhancement. Demographic data on age, gender, income range, and conference distribution are also analyzed."

Download Presentation

Please find below an Image/Link to download the presentation.
The content on the website is provided AS IS for your information and personal use only. It may not be sold, licensed, or shared on other websites without obtaining consent from the author. If you encounter any issues during the download, it is possible that the publisher has removed the file from their server.
You are allowed to download the files provided on this website for personal or commercial use, subject to the condition that they are used lawfully. All files are the property of their respective owners.
The content on the website is provided AS IS for your information and personal use only. It may not be sold, licensed, or shared on other websites without obtaining consent from the author.
E N D
Presentation Transcript
ZWUC Customer Experience Survey Presented by Thando Nkomo Maracomms Global ZWUC Customer Experience Survey 2018
Objectives i. To identify the cognitive and affective perceptions held by clients of the ZWUC treasury department. To measure customer service experience of ZWUC treasury department clients. iii. To determine the drivers and inhibitors of positive customer experience amongst ZWUC treasury department clients. iv. To derive solutions for enhancing customer experience at the ZWUC treasury department. ii. ZWUC Customer Experience Survey 2018
Methodology Research Paradigm: Pragmatism Approach: Mixed Methods Design: Sequential Explanatory (QUAN + Qual) Method: Cross Sectional Survey Population: 20 000 (Est. No. of Camp meeting attendees) Sample: 384 (RAOSOFT Recommended) Sampling technic: Stratified Sampling of camp meeting sites/Random sampling of respondents at selected camp meeting sites Data gathering tools: Self Administered Questionnaires (QUAN) + Focus Group Discussions (QUAL) ZWUC Customer Experience Survey 2018
QUANT Respondents overview Number of respondents: 223 Valid Responses: 217 Response rate: 56.5% WZC: 124 (57.1%) SZC: 92 (42.4%) Not stated: 1 (0.05%) Comment Poor response rate owing to respondents failing to return questionnaires to the research team on time. ZWUC Customer Experience Survey 2018
DEMOGRAPHIC DATA Age Distribution Age 26.9 22.9 15.2 14.8 8.1 6.7 5.4 10 TO 20 21 TO 30 31 TO 40 41 TO 50 51 TO 60 OVER 60 MISSING Age ZWUC Customer Experience Survey 2018
DEMOGRAPHIC DATA Gender Distribution Gender 7% Male 47% Female Missing 46% ZWUC Customer Experience Survey 2018
DEMOGRAPHIC DATA Distribution by Conferences Conferences 0% WZC 43% SZC 57% Missing ZWUC Customer Experience Survey 2018
DEMOGRAPHIC DATA Income range of respondents Income 50.7 20.2 4 1.3 1.3 1.8 0-500 501-1000 1001-1500 1501-2000 2001-2500 Over 2500 ZWUC Customer Experience Survey 2018
DEMOGRAPHIC DATA Frequency of access to treasury services Freq. of Access to Treasury Services 53.4 24.2 10.3 9.9 2.2 Weekly Monthly Quarterly Missing Other ZWUC Customer Experience Survey 2018
DEMOGRAPHIC DATA Point of access to Treasury Services Points of Access 76.2 18.8 3.6 1.3 Local Church Conference offices Other Missing ZWUC Customer Experience Survey 2018
Objective 1: To identify the cognitive/affective perceptions held by clients of the ZWUC treasury department. Sub Question: What do respondents think/feel about the ZWUC treasury department infrastructure, officers & processes? Key assumption Cognitive/Affective perceptions are driven by what ZWUC clients feel/think about the treasury department at local church and conference levels. ZWUC Customer Experience Survey 2018
Local Church Cognitive/Affective Factors Awareness / visibility Organisation Equipped to do job Qualifications Appropriate Work Environment Comfortable to relate ZWUC Customer Experience Survey 2018
Awareness of local church treasury staff Awareness 44.4 43.9 5.8 0.9 1.3 3.6 Strongly Disagree Disagree Undecided Agree Strongly Disagree Missing ZWUC Customer Experience Survey 2018
Is the treasury team organised? Organised 56.1 30.9 4 3.6 3.1 2.2 Strongly Disagree Disagree Undecided Agree Strongly Agree Missing ZWUC Customer Experience Survey 2018
Is the treasury team qualified? Qualified 42.2 30.9 17 4 4 1.8 Strongly Disagree Disagree Undecided ZWUC Customer Experience Survey 2018 Agree Strongly Agree Missing
Is the treasury team equipped to do its job? 40.4 24.7 18.4 7.6 4.9 4 Strongly Disagree Disagree Undecided Agree Strongly Agree Missing ZWUC Customer Experience Survey 2018
Does the treasury team work in an appropriate environment? Environment 39.9 17.5 15.7 15.2 8.2 5.8 Strongly Disagree Disagree Undecided Agree Strongly Agree Missing ZWUC Customer Experience Survey 2018
Do church members feel comfortable relating with the treasury team? 44.8 42.2 8.2 2.7 3.6 4 Stongly Disagree Disagree Undecided Agree Strongly Agree Missing ZWUC Customer Experience Survey 2018
Local Church Cognitive/Affective Score Positive: 76.3% Negative: 10.01% Neutral: 10.68% Summary of Cognitive/Affective Perceptions There is a generally positive view towards the local church treasury department and its processes although there is a strong need to improve on treasury department work environment and equipment. ZWUC Customer Experience Survey 2018
Visual appeal of offices Conference Level Cognitive / Affective Factors Cleanliness / Smartness Profession al Look Professional Feel / Atmosphere Air Comfort / Ease Conditioning Need for Improvement Tidiness ZWUC Customer Experience Survey 2018
The treasury Offices are Visually Appealing 37.7 22.9 15.7 10.3 9.9 3.6 Strongly Disagree Disagree Undecided Agree Strongly Agree Missing ZWUC Customer Experience Survey 2018
The treasury Offices look professional ? 41.3 22 11.7 11.2 9.9 4 Strongly Disagree Disagree Undecided Agree Strongly Agree Missing ZWUC Customer Experience Survey 2018
Treasury offices feel professional? 40.4 22.9 14.8 10.3 9.4 2.2 Strongly Disagree Disagree Undecided Agree Strgly Agree Missing ZWUC Customer Experience Survey 2018
Treasury offices are always clean and smart 45.3 23.3 14.3 13.5 2.2 1.3 Strongly Disagree Disagree Undecided Agree Strgly Agree Missing ZWUC Customer Experience Survey 2018
The air conditioning is good 35.4 27.4 15.7 9.9 6.3 5.4 Strongly Disagree Disagree Undecided Agree Strgly Agree Missing ZWUC Customer Experience Survey 2018
I feel very comfortable to be in the treasury offices 36.8 27.4 10.3 7.6 3.1 Strongly Disagree Disagree Undecided Agree Strgly Agree Missing ZWUC Customer Experience Survey 2018
The treasury offices need to be spruced up 29.6 29.1 17.9 13.5 7.2 2.7 Strongly Disagree Disagree Undecided Agree Strgly Agree Missing ZWUC Customer Experience Survey 2018
The treasury staff need to tidy up their offices 24.7 24.7 22.4 15.7 7.2 5.4 Strongly Disagree Disagree Undecided Agree Strgly Agree Missing ZWUC Customer Experience Survey 2018
Conference Level Cognitive/Affective Score Positive: 40.55% Negative: 18.48% Neutral: 26.02% Invalid: 14.95% Summary of Cognitive/Affective Perceptions The less than 50% positive score indicates a worrisome perception rating. Less than 50% of the respondents have a positive perception towards the treasury department at conference level. This points to an image and reputational risk. There is need to improve this rating through improving performance across the customer experience touch points. ZWUC Customer Experience Survey 2018
Objective 2: To measure customer service experience of ZWUC treasury department clients. Sub Question: How do ZWUC clients at local and Conference level feel about treasury service access and quality Key assumption Customer experience is driven by what ZWUC clients feel about service access and quality at local church and conference offices. ZWUC Customer Experience Survey 2018
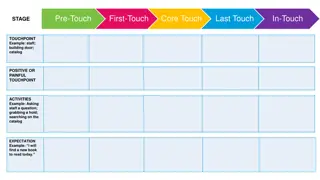
Treatment / customer care Local Church Customer Experience Variables Efficiency expectation Time Spent Service Service satisfaction Recommendation ZWUC Customer Experience Survey 2018
Treatment exceeds expectations 55.2 21.1 9.9 7.2 1.8 4.9 Strongly Disagree Disagree Undecided Agree Strgly Agree Missing ZWUC Customer Experience Survey 2018
Service access is efficient and exceeds expectations? 52.5 17 14.8 7.2 5.8 2.7 Strongly Disagree Disagree Undecided Agree Strgly Agree Missing ZWUC Customer Experience Survey 2018
Time spent accessing services is minimal 54.3 15.2 11.2 10.8 6.3 2.2 Strongly Disagree Disagree Undecided Agree Strgly Agree Missing ZWUC Customer Experience Survey 2018
Service needs are always adequately met 53.8 17.9 10.3 9.4 7.2 1.3 Strongly Disagree Disagree Undecided Agree Strgly Agree Missing ZWUC Customer Experience Survey 2018
No hesitation to return for more services in future 53.8 23.8 9 7.6 1.3 4.5 Strongly Disagree Disagree Undecided Agree Strgly Agree Missing ZWUC Customer Experience Survey 2018
Local Church Customer Experience Score Positive: 72.92% Negative: 9.76% Neutral: 10.96% Invalid: 6.36% Summary of Customer Experience Ratings There is very positive customer experience at the local church level. There is need to maintain and even improve this to beyond 80% satisfaction rating. Maintaining and improving this should translate to greater image and reputational security and more positive behavior towards treasury department initiatives. ZWUC Customer Experience Survey 2018
Treatment / customer care Return Intention Conference Level Customer Experience Variables Efficiency expectation Time Spent Service Service satisfaction Recommendation ZWUC Customer Experience Survey 2018
Treatment exceeds expectations 41.3 26 17 8.5 6.3 0.9 Strongly Disagree Disagree Undecided Agree Strgly Agree Missing ZWUC Customer Experience Survey 2018
Service access is efficient and exceeds expectations 37.7 25.1 20.2 9 6.3 1.8 Strongly Disagree Disagree Undecided Agree Strgly Agree Missing ZWUC Customer Experience Survey 2018
Minimal time spent in accessing services? 36.8 25.6 19.3 12.1 4 2.2 Strongly Disagree Disagree Undecided Agree Strgly Agree Missing ZWUC Customer Experience Survey 2018
Service needs are always adequately met? 39.9 23.3 20.2 9 6.7 0.9 Strongly Disagree Disagree Undecided Agree Strgly Agree Missing ZWUC Customer Experience Survey 2018
No hesitation to return for more services in future? 40.8 24.7 20.2 8.5 4 1.8 Strongly Disagree Disagree Undecided Agree Strgly Agree Missing ZWUC Customer Experience Survey 2018
Will recommend others to access services at conference? 39 26.5 20.6 9.4 0.9 3.6 Strongly Disagree Disagree Undecided Agree Strongly Agree Missing ZWUC Customer Experience Survey 2018
Conference Level Customer Experience Score Positive: 46.48% Negative: 8.75% Neutral: 25.2% Invalid: 19.57% Summary of Customer Experience Ratings Customer experience at conference level is poor and needs to be pushed to 60% at the very least. There is need for improving customer service across all customer experience variables to ensure lower levels of undecided clients. ZWUC Customer Experience Survey 2018
Objective 3 To determine the drivers and inhibitors of positive customer experience amongst ZWUC treasury department clients. Positive Scores Analysis Inhibitor Score: Neutral Score: Enabler Score: 0-40% 41-59% 60 100% ZWUC Customer Experience Survey 2018
Local Church enablers/Inhibitors Inhibitor (0 40% Score) Neutral Enabler (41 - 59 % Score) (60 100 % Score) Awareness of staff There is need to improve on the work environment i.e. provision of suitable and comfortable working space and equipment Level of Organisation Team qualifications Team capacity Work environment Relationality Customer Care Service access and Efficiency Timeousness Service satisfaction ZWUC Customer Experience Survey 2018
Conference Level enablers or inhibitors Inhibitor (0 40% Score) Neutral Enabler (41 - 59 % Score) (60 100 % Score) Visual Appeal While air conditioning and tidiness are inhibitors, the data points to a general need for improvement across all variables. Cleanliness/Smartness Professional Look Professional feel Comfortable feeling Air Conditioning Tidiness Customer care Service Efficiency Timeousness Service satisfaction ZWUC Customer Experience Survey 2018
Objective 4 To derive solutions for enhancing customer experience at the ZWUC treasury department. ZWUC Customer Experience Survey 2018
Feedback From Respondents They must be open to the congregation so that people can get help from them There is need for the treasury team to be accessible during the week Treasury team needs equipment like calculators to make their work easier Need for timely supply of envelopes A proper office should be constructed for the Treasury team Need for The church should buy a laptop and printer for the treasury department There is need for more training of the treasury staff computerization of services Need for a well furnished office for the treasury staff Envelopes should be returned in due time with no delays Need for qualified people with book keeping background The local church should have a POS machine ZWUC Customer Experience Survey 2018