Explore the concept of exponential functions and their practical applications, including calculating interest payments in varying intervals. Learn about the special number 'e' and its significance in mathematics, as well as how differentiation relates to gradient functions.
Please find below an Image/Link to download the presentation.
The content on the website is provided AS IS for your information and personal use only. It may not be sold, licensed, or shared on other websites without obtaining consent from the author. If you encounter any issues during the download, it is possible that the publisher has removed the file from their server.
You are allowed to download the files provided on this website for personal or commercial use, subject to the condition that they are used lawfully. All files are the property of their respective owners.
The content on the website is provided AS IS for your information and personal use only. It may not be sold, licensed, or shared on other websites without obtaining consent from the author.
Introduction We are going to look at exponential functions We will learn about a new special number in Mathematics We will see how this number can be used in practical problems
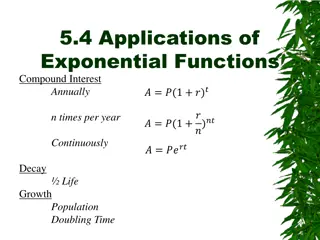
The Exponential and Log Functions Imagine you have 100 in a bank account Imagine your interest rate for the year is 100% You will receive 100% interest in one lump at the end of the year, so you will now have 200 in the bank However, you are offered a possible alternative way of being paid Your bank manager says, If you like, you can have your 100% interest split into two 50% payments, one made halfway through the year, and one made at the end How much money will you have at the end of the year, doing it this way (and what would be the quickest calculation to work that out?) 100 x 1.52 = 225 Investigate further. What would happen if you split the interest into 4, or 10, or 100 smaller bits etc 3A
The Exponential and Log Functions Start Amount Interest Each Payment Payments Sum Total (2dp) 100 1 100% 100 x 2 200 100 2 50% 100 x 1.52 225 100 4 25% 100 x 1.254 244.14 100 8 12.5% 100 x 1.1258 256.58 100 10 10% 100 x 1.110 259.37 100 20 5% 100 x 1.0520 265.33 100 50 2% 100 x 1.0250 269.16 100 100 1% 100 x 1.01100 270.48 1,000 0.1% 100 x 1.0011000 271.69 100 100 10,000 0.01% 100 x 1.000110000 271.81 100 n 100/n 100 x (1 + 1/n)n 100e The larger the value of n, the better the accuracy of e The value of e is irrational, like It also has another interesting property n 1 n + = 1 e (2.718281828459 ) 3A
The Exponential and Log Functions y = x2 Gradient Functions You have already learnt about differentiation, that differentiating a graph function gives the gradient function We can plot the gradient function on the graph itself y = 2x The Gradient at this point is this value here! y = x2 So dy/dx = 2x 3A
The Exponential and Log Functions y = 3x2 y = x3 Gradient Functions You have already learnt about differentiation, that differentiating a graph function gives the gradient function We can plot the gradient function on the graph itself is this value here! The And the Gradient is the same here! Gradient at this point y = x3 So dy/dx = 3x2 3A
The Exponential and Log Functions Gradient Functions You have already learnt about differentiation, that differentiating a graph function gives the gradient function We can plot the gradient function on the graph itself y = 2x y = 2xln2 y = 2x At this stage, you do not need to know where this comes from dy/dx = 2xln2 3A
The Exponential and Log Functions y = 3xln3 Gradient Functions You have already learnt about differentiation, that differentiating a graph function gives the gradient function We can plot the gradient function on the graph itself y = 3x y = 3x At this stage, you do not need to know where this comes from dy/dx = 3xln3 3A
The Exponential and Log Functions y = 2x y = 2xln2 y = 3x y = 3xln3 What has happened from the first graph to the second? The lines have crossed Therefore the must be a value between 2 and 3 where the lines are equal 3A
The Exponential and Log Functions Gradient Functions If we plot a graph of ex, its gradient function is the same graph! y = ex y = ex This leads to an interesting conclusion If y = ex Then dy/dx = ex as well! 3A
The Exponential and Log Functions The Graph of ex is used rather than 2x or 3x because e is the increase when growth is continuous (ie growth is always happening, rather than in chunks ) The majority of growth follows this format, bacterial growth is continuous for example. Transforming the graph can also allow graphs to show decreases, such as radioactive decay and depreciation 3A
The Exponential and Log Functions y = 2ex y = ex You need to be able to sketch transformations of the graph y = ex (0,2) (0,1) y = ex f(x) y = 2ex 2f(x) (For the same set of inputs (x), the outputs (y) double) 3A
The Exponential and Log Functions y = ex y = ex + 2 You need to be able to sketch transformations of the graph y = ex (0,3) (0,1) y = ex f(x) y = ex + 2 f(x) + 2 (For the same set of inputs (x), the outputs (y) increase by 2) 3A
The Exponential and Log Functions y = ex You need to be able to sketch transformations of the graph y = ex (0,1) y = ex f(x) (0,-1) y = -ex y = -ex -f(x) (For the same set of inputs (x), the outputs (y) swap signs 3A
The Exponential and Log Functions y = ex y = e2x You need to be able to sketch transformations of the graph y = ex (0,1) y = ex f(x) y = e2x f(2x) (The same set of outputs (y) for half the inputs (x)) 3A
The Exponential and Log Functions y = ex y = ex+ 1 You need to be able to sketch transformations of the graph y = ex (0,e) (0,1) y = ex f(x) y = ex + 1 f(x + 1) (The same set of outputs (y) for inputs (x) one less than before ) We can work out the y-intercept by substituting in x = 0 This gives us e1 = e 3A
The Exponential and Log Functions y = ex y = e-x You need to be able to sketch transformations of the graph y = ex (0,1) (0,1) y = ex f(x) y = e-x f(-x) (The same set of outputs (y) for inputs with the opposite sign 3A
The Exponential and Log Functions y = 10e-x y = ex You need to be able to sketch transformations of the graph y = ex y = e-x (0, 10) Sketch the graph of: (0, 1) y = 10e-x The graph of e-x, but with y values 10 times bigger 3A
The Exponential and Log Functions y = ex You need to be able to sketch transformations of the graph y = ex (0, 7) (0, 4) y = 3 + 4e0.5x y = e0.5x y = 4e0.5x Sketch the graph of: (0, 1) y = 3 + 4e0.5x The graph of e0.5x, but with y values 4 times bigger with 3 added on at the end 3A
The Exponential and Log Functions You need to be able to used the Exponential and Log Functions to solve problems -t 10 P = 16000e -0 10 P = 16000e The Price of a used car is given by the formula: P = 16000e0 -t 10 P = 16000e P = 16000 a) Calculate the value of the car when it is new The new price implies t, the time, is 0 Substitute t = 0 into the formula 3A
The Exponential and Log Functions You need to be able to used the Exponential and Log Functions to solve problems -t 10 P = 16000e -5 10 P = 16000e The Price of a used car is given by the formula: P = 16000e-0.5 -t 10 P = 16000e P = 9704.49 b) Calculate the value after 5 years 5 years implies t = 5 Substitute t = 5 into the formula 3A
The Exponential and Log Functions You need to be able to used the Exponential and Log Functions to solve problems -t 10 P = 16000e P = 16000 x 0 The Price of a used car is given by the formula: P = 0 -t 10 P = 16000e c) What is the implied value of the car in the long run (ie what value does it tend towards?) Imagine t tends towards infinity (gets really big) 1 -t 10 e (10 e)t Bigger t = Bigger denominator = Smaller Fraction value 3A
The Exponential and Log Functions P You need to be able to used the Exponential and Log Functions to solve problems 16000 -t 10 The Price of a used car is given by the formula: P = 16000e -t 10 P = 16000e t d) Sketch the Graph of P against t Value starts at 16000 Tends towards 0, but doesn t get there t is independent so goes on the x axis P is dependant on t so goes on the y axis 3A
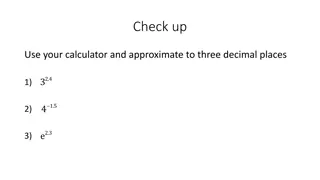
The Exponential and Log Functions You need to be able to solve equations involving natural logarithms and e Example Question 1 xe = 3 Take natural logs of both sides = xe ln( ) ln(3) This is largely done in the same way as in C2 logarithms, but using ln instead of log Use the power law ln(e) = 1 (e to the power something is e) Work out the answer or leave as a logarithm e = ln( ) x = ln(3) x ln(3) x = 1.099 You do not necessarily need to write these steps 3B
The Exponential and Log Functions You need to be able to solve equations involving natural logarithms and e Example Question 1 += 2 xe ln( 7 ) Take natural logs + = 2 xe ln(7) This is largely done in the same way as in C2 logarithms, but using ln instead of log Use the power law x+ = 2 ln(7) Subtract 2 x = ln(7) 2 Work out the answer or leave as a logarithm x = 0.054 3B
The Exponential and Log Functions You need to be able to solve equations involving natural logarithms and e Example Question 1 x = ln 4 Reverse ln = 4 x e This is largely done in the same way as in C2 logarithms, but using ln instead of log Work it out if needed x = 54.598 3B
The Exponential and Log Functions You need to be able to solve equations involving natural logarithms and e Example Question 1 x = ln(3 2) 3 Reverse ln = 3 3 2 x e This is largely done in the same way as in C2 logarithms, but using ln instead of log Add 2 = + 3 3 2 x e Divide by 3 + 3 2 e = x 3 3B
The Exponential and Log Functions y = ex y = x You need to be able to plot and understand graphs of the function which is inverse to ex y = lnx (0,1) The inverse of ex is logex (usually written as lnx) (1,0) We know from chapter 2 that an inverse function is a reflection in the line y = x 3B
The Exponential and Log Functions y = 2lnx You need to be able to plot and understand graphs of the function which is inverse to ex y = lnx (1,0) y = lnx f(x) y = 2lnx 2f(x) All output (y) values doubled for the same input (x) values 3B
The Exponential and Log Functions y = lnx + 2 You need to be able to plot and understand graphs of the function which is inverse to ex y = lnx (0.14,0) (1,0) y = lnx f(x) y = lnx + 2 f(x) + 2 = = + + ln ln ln x 2 2 y 0 2 x x Let y = 0 All output (y) values increased by 2 for the same input (x) values Subtract 2 = Inverse ln = 2 e x x Work out x! = 0.13533... 3B
The Exponential and Log Functions You need to be able to plot and understand graphs of the function which is inverse to ex y = lnx (1,0) y = lnx f(x) y = -lnx y = -lnx -f(x) All output (y) values swap sign for the same input (x) values 3B
The Exponential and Log Functions You need to be able to plot and understand graphs of the function which is inverse to ex y = ln(2x) y = lnx (0.5,0) (1,0) y = ln(x) f(x) y = ln(2x) f(2x) All output (y) values the same, but for half the input (x) values 3B
The Exponential and Log Functions You need to be able to plot and understand graphs of the function which is inverse to ex y = ln(x + 2) y = lnx (0, ln2) (-1,0) (1,0) y = ln(x) f(x) y = ln(x + 2) f(x + 2) = + ln( 2) y x All output (y) values the same, but for input (x) values 2 less than before Let x = 0 y = ln(2) Work it out (or leave as ln2) y = 0.69314... 3B
The Exponential and Log Functions You need to be able to plot and understand graphs of the function which is inverse to ex y = ln(-x) y = lnx (-1,0) (1,0) y = ln(x) f(x) y = ln(-x) f(-x) All output (y) values the same, but for input (x) values with the opposite sign to before 3B
The Exponential and Log Functions y = 3 + ln(2x) You need to be able to plot and understand graphs of the function which is inverse to ex y = lnx y = ln(2x) (0.025,0) Sketch the graph of: (1,0) y = 3 + ln(2x) 3 ln(2 ) = + 3 ln(2 ) x = + ln(2 ) x = y 0 3 x Let y = 0 The graph of ln(2x), moved up 3 spaces Subtract 3 Reverse ln = 3 3 2 e e x Divide by 2 = x 2 3B
The Exponential and Log Functions x = 3 You need to be able to plot and understand graphs of the function which is inverse to ex y = ln(3 + x) y = lnx y = ln(3 - x) (0,ln3) (2,0) Sketch the graph of: (-2,0) (1,0) y = ln(3 - x) The graph of ln(x), moved left 3 spaces, then reflected in the y axis. You must do the reflection last! = ln(3 ln(3) ) y y = x Let x = 0 3B
The Exponential and Log Functions You need to be able to plot and understand graphs of the function which is inverse to ex t = 150 80 N e 40 t = 0 0 40 = 150 80 N e The number of elephants in a herd can be represented by the equation: = 150 80 0 N e t e0 = 1 = 150 80 N e 40 N = 150 80 Where n is the number of elephants and t is the time in years after 2003. N = 70 a) Calculate the number of elephants in the herd in 2003 Implies t = 0 3B
The Exponential and Log Functions You need to be able to plot and understand graphs of the function which is inverse to ex t = 150 80 N e 40 t = 4 4 40 = 150 80 N e The number of elephants in a herd can be represented by the equation: N = 150 72.4 Round to the nearest whole number t = 150 80 N e 40 N = 77.6 (78) Where n is the number of elephants and t is the time in years after 2003. b) Calculate the number of elephants in the herd in 2007 Implies t = 4 3B
The Exponential and Log Functions You need to be able to plot and understand graphs of the function which is inverse to ex t = 150 80 N e 40 N = 100 t 100 150 80 = e 40 The number of elephants in a herd can be represented by the equation: Subtract 150 t = 50 80 e 40 t = 150 80 N e 40 Divide by -80 t = Where n is the number of elephants and t is the time in years after 2003. 0.625 e 40 Take natural logs t = ln(0.625) c) Calculate the year when the population will first exceed 100 elephants Implies N = 100 40 Multiply by 40 = 40ln(0.625) t t = 18.8 (19 years) 2003 + 19 = 2022 3B
The Exponential and Log Functions You need to be able to plot and understand graphs of the function which is inverse to ex t = 150 80 N e 40 t The number of elephants in a herd can be represented by the equation: e 40 Rearrange 1 t = 150 80 N e 40 ( ) t 40 e Where n is the number of elephants and t is the time in years after 2003. As t increases Denomintor becomes bigger Fraction becomes smaller, towards 0 d) What is the implied maximum number in the herd? Implies t N = 150 3B
Summary We have learnt a new number, e, and seen what is stands for and where it is used We have plotted the graph of ex and lnx, which are inverse functions We have seen how to transform these graphs We have solved practical problems involving these We have also seen again how to solve logarithmic equations