Exponential Growth and Decay Models Exploration
Examine various exponential functions in real-life scenarios, understanding their shapes, properties, and asymptotes. Learn to identify key parameters like y-intercept, growth rate, and asymptotic lines.

Download Presentation

Please find below an Image/Link to download the presentation.
The content on the website is provided AS IS for your information and personal use only. It may not be sold, licensed, or shared on other websites without obtaining consent from the author.If you encounter any issues during the download, it is possible that the publisher has removed the file from their server.
You are allowed to download the files provided on this website for personal or commercial use, subject to the condition that they are used lawfully. All files are the property of their respective owners.
The content on the website is provided AS IS for your information and personal use only. It may not be sold, licensed, or shared on other websites without obtaining consent from the author.
E N D
Presentation Transcript
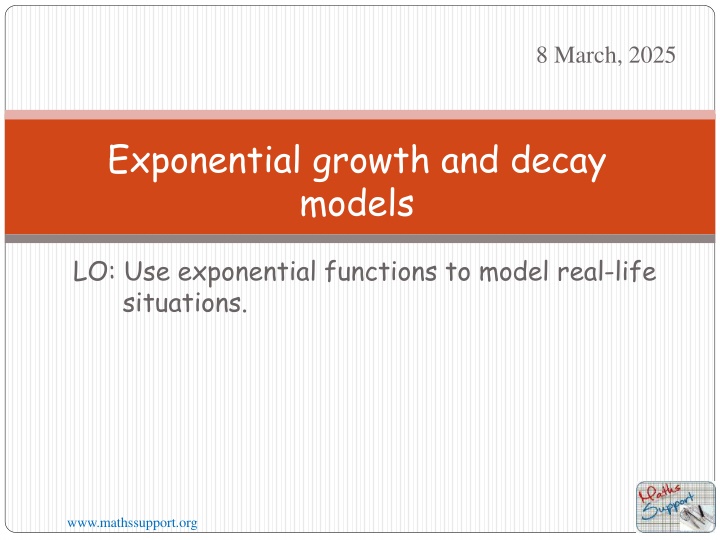
8 March, 2025 Exponential growth and decay models LO: Use exponential functions to model real-life situations. www.mathssupport.org
Exponential function An exponential function has a number, called the base, raised to a power, In general, the form of an exponential function is: f(x) = kax + c where a > 0, a 1andk 0 Let s look at the shape of some exponential functions y = 2x (0, 1) the independent variable (x) is the index or power. What is the y-intercept? y Is the graph increasing or decreasing? Increasing. It is called exponential Growth What is the value of k? of a? 2 1 of c? 0 What is the line that the graph get closer to, but never touch? The x-axis. Its equation isy = 0 x It is called an asymptote www.mathssupport.org
Exponential function An exponential function has a number, called the base, raised to a power, In general, the form of an exponential function is: f(x) = kax + c where a > 0, a 1andk 0 Let s look at the shape of some exponential functions y = 3x (0, 1) the independent variable (x) is the index or power. What is the y-intercept? y Is the graph increasing or decreasing? Increasing. It is called exponential Growth What is the value of k? of a? 3 1 of c? 0 What is the line that the graph get closer to, but never touch? The x-axis. Its equation isy = 0 x It is called an asymptote www.mathssupport.org
Exponential function An exponential function has a number, called the base, raised to a power, In general, the form of an exponential function is: f(x) = kax + c where a > 0, a 1andk 0 Let s look at the shape of some exponential functions y = 3(2)x (0, 3) the independent variable (x) is the index or power. What is the y-intercept? y Is the graph increasing or decreasing? Increasing. It is called exponential Growth What is the value of k? of a? 2 3 of c? 0 What is the line that the graph get closer to, but never touch? The x-axis. Its equation isy = 0 x It is called an asymptote www.mathssupport.org
Exponential function An exponential function has a number, called the base, raised to a power, In general, the form of an exponential function is: f(x) = kax + c where a > 0, a 1andk 0 Let s look at the shape of some exponential functions y = 3(2)x - 1 (0, 3) the independent variable (x) is the index or power. What is the y-intercept? y Is the graph increasing or decreasing? Increasing. It is called exponential Growth What is the value of k? of a? 2 3 of c? -1 What is the line that the graph get closer to, but never touch? The line with equationy = 1 It is called an asymptote x www.mathssupport.org
Exponential function An exponential function has a number, called the base, raised to a power, In general, the form of an exponential function is: f(x) = kax + c where a > 0, a 1andk 0 Let s look at the shape of some exponential functions What is the y-intercept? (0, 1) ? the independent variable (x) is the index or power. ? ? y = y Is the graph increasing or decreasing? Decreasing. It is called exponential Decay What is the value of k? of a? 2 1 of c? 0 1 What is the line that the graph get closer to, but never touch? The x-axis. Its equation isy = 0 x It is called an asymptote www.mathssupport.org
Exponential function An exponential function has a number, called the base, raised to a power, In general, the form of an exponential function is: f(x) = kax + c where a > 0, a 1andk 0 Let s look at the shape of some exponential functions What is the y-intercept? (0, 4) ? the independent variable (x) is the index or power. ?+ 3 ? y = y Is the graph increasing or decreasing? Decreasing. It is called exponential Decay What is the value of k? of a? 2 1 of c? 3 1 What is the line that the graph get closer to, but never touch? The line with equationy = 3 It is called an asymptote x www.mathssupport.org
Exponential function Sumarising. In general, the form of an exponential function is: f(x) = kax + c where a > 0, a 1andk 0 The parameter k is the vertical stretch factor If a > 1 the graph is increasing so, it is exponential growth If 0 < a < 1 the graph is decreasing so, it is exponential decay The parameter c is the vertical translation of the graph. The equation of the horizontal asymptote is y = c The y-intercept is the point (0, k + c) www.mathssupport.org
Sketching the graph of an exponential function You need to be careful when copying the graph from your GDC onto paper. f(x) = 4(25)0.18x+ 2 3 x 3 Sketch the graph of Draw your axes and label them Make sure that any x- and y-intercepts are in the correct place. Determine the position of any asymptote. Plot the starting and ending points based on the given domain y (3, 24.75) 25 (0, 6) ( 3, 2.70) y = 2 x 0 3 3 www.mathssupport.org
Modelling with a exponential function Exponential functions can be used to model real world data. The data in the following table list the population of Benin from 1980 through 2019. (Source: https://data.worldbank.org/) Find an exponential function that models the data of the form y = abx Turn on the calculator. 1990 4 978 496 Click STAT (Statistics) Year Population 1980 3 717 165 1985 4 278 501 1995 5 905 558 2000 6 865 951 2005 7 982 225 2010 9 199 259 2015 10 575 952 2019 11 801 151 www.mathssupport.org
Modelling with a exponential function Exponential functions can be used to model real world data. The data in the following table list the population of Benin from 1980 through 2019. (Source: https://data.worldbank.org/) Find an exponential function that models the data of the form y = abx 1985 4 278 501 Turn on the calculator. Click STAT (Statistics) Press 1 (Edit) Year Population 1980 3 717 165 1990 4 978 496 1995 5 905 558 2000 6 865 951 2005 7 982 225 2010 9 199 259 2015 10 575 952 2019 11 801 151 www.mathssupport.org
Modelling with a exponential function Exponential functions can be used to model real world data. The data in the following table list the population of Benin from 1980 through 2019. (Source: https://data.worldbank.org/) Find an exponential function that models the data of the form y = abx 1985 4 278 501 (85) Turn on the calculator. Click STAT (Statistics) Press 1 (Edit) Year Population (80) 1980 3 717 165 (90) 1990 4 978 496 (95) 1995 5 905 558 Clear all lists in the GDC Type the data for Year in List 1 and Population in List 2 To make it simpler we will change the year numbers (100) 2000 6 865 951 (105) 2005 7 982 225 (110) 2010 9 199 259 (115) 2015 10 575 952 (119) 2019 11 801 151 www.mathssupport.org
Modelling with a exponential function Exponential functions can be used to model real world data. The data in the following table list the population of Benin from 1980 through 2019. (Source: https://data.worldbank.org/) Find an exponential function that models the data of the form y = abx Turn on the calculator. 1990 4 978 496 (90) Click STAT (Statistics) Press 1 (Edit) Year Population (80) 1980 3 717 165 (85) 1985 4 278 501 (95) 1995 5 905 558 Clear all lists in the GDC Type the data for Year in List 1 and Population in List 2 Press 2nd statplot (100) 2000 6 865 951 (105) 2005 7 982 225 (110) 2010 9 199 259 (115) 2015 10 575 952 (119) 2019 11 801 151 www.mathssupport.org
Modelling with a exponential function Exponential functions can be used to model real world data. The data in the following table list the population of Benin from 1980 through 2019. (Source: https://data.worldbank.org/) Find an exponential function that models the data of the form y = abx Turn on the calculator. 1990 4 978 496 (90) Click STAT (Statistics) Press 1 (Edit) Year Population (80) 1980 3 717 165 (85) 1985 4 278 501 (95) 1995 5 905 558 Clear all lists in the GDC Type the data for Year in List 1 and Population in List 2 Press 2nd statplot Press 1 (100) 2000 6 865 951 (105) 2005 7 982 225 (110) 2010 9 199 259 (115) 2015 10 575 952 (119) 2019 11 801 151 www.mathssupport.org
Modelling with a exponential function Exponential functions can be used to model real world data. The data in the following table list the population of Benin from 1980 through 2019. (Source: https://data.worldbank.org/) Find an exponential function that models the data of the form y = abx Turn on the calculator. 1990 4 978 496 (90) Click STAT (Statistics) Press 1 (Edit) Year Population (80) 1980 3 717 165 (85) 1985 4 278 501 (95) 1995 5 905 558 Clear all lists in the GDC Type the data for Year in List 1 and Population in List 2 Press 2nd statplot Press 1 Plot1 ON Xlist: L1 Ylist: L2 ZOOM 9 ZoomStat (100) 2000 6 865 951 (105) 2005 7 982 225 (110) 2010 9 199 259 (115) 2015 10 575 952 (119) 2019 11 801 151 www.mathssupport.org
Modelling with a exponential function Exponential functions can be used to model real world data. The data in the following table list the population of Benin from 1980 through 2019. (Source: https://data.worldbank.org/) Find an exponential function that models the data of the form y = abx Turn on the calculator. 1990 4 978 496 (90) Click STAT (Statistics) Press 1 (Edit) Year Population (80) 1980 3 717 165 (85) 1985 4 278 501 (95) 1995 5 905 558 Clear all lists in the GDC Type the data for Year in List 1 and Population in List 2 Press 2nd statplot Press 1 Plot1 ON Xlist: L1 Ylist: L2 ZOOM 9 ZoomStat Press MODE. (100) 2000 6 865 951 (105) 2005 7 982 225 (110) 2010 9 199 259 (115) 2015 10 575 952 (119) 2019 11 801 151 www.mathssupport.org
Modelling with a exponential function Exponential functions can be used to model real world data. The data in the following table list the population of Benin from 1980 through 2019. (Source: https://data.worldbank.org/) Find an exponential function that models the data of the form y = abx 1985 4 278 501 (85) Use the arrow to highlight STAT DIAGNOSIS ON Press STAT Year Population (80) 1980 3 717 165 (90) 1990 4 978 496 (95) 1995 5 905 558 (100) 2000 6 865 951 (105) 2005 7 982 225 (110) 2010 9 199 259 (115) 2015 10 575 952 (119) 2019 11 801 151 www.mathssupport.org
Modelling with a exponential function Exponential functions can be used to model real world data. The data in the following table list the population of Benin from 1980 through 2019. (Source: https://data.worldbank.org/) Find an exponential function that models the data of the form y = abx 1985 4 278 501 (85) Use the arrow to highlight STAT DIAGNOSIS ON Press STAT Scroll down 0:ExpReg Year Population (80) 1980 3 717 165 (90) 1990 4 978 496 CALC (95) 1995 5 905 558 (100) 2000 6 865 951 (105) 2005 7 982 225 (110) 2010 9 199 259 (115) 2015 10 575 952 (119) 2019 11 801 151 www.mathssupport.org
Modelling with a exponential function Exponential functions can be used to model real world data. The data in the following table list the population of Benin from 1980 through 2019. (Source: https://data.worldbank.org/) Find an exponential function that models the data of the form y = abx 1985 4 278 501 (85) Use the arrow to highlight STAT DIAGNOSIS ON Press STAT Scroll down 0:ExpReg Xlist: L1 Ylist: L2 Store RegEqPress Vars Y-VARS 1-Function Year Population (80) 1980 3 717 165 (90) 1990 4 978 496 CALC (95) 1995 5 905 558 (100) 2000 6 865 951 (105) 2005 7 982 225 (110) 1-Y1 2010 9 199 259 Scroll down Calculate ENTER (115) 2015 10 575 952 (119) 2019 11 801 151 www.mathssupport.org
Modelling with a exponential function Exponential functions can be used to model real world data. The data in the following table list the population of Benin from 1980 through 2019. (Source: https://data.worldbank.org/) Year The general exponential function is: Population (80) 1980 3 717 165 y = abx (85) 1985 4 278 501 From the GDC we get a = 338 955 The data can be modelled with the function (90) 1990 4 978 496 b = 1.03 (95) 1995 5 905 558 (100) 2000 6 865 951 y = 338 955(1.03)x The coefficient of determination R2 reveals that 99.9% of the data fit the regression model Drawing the graph (105) 2005 7 982 225 (110) 2010 9 199 259 (115) 2015 10 575 952 (119) 2019 11 801 151 ZOOM 9 ZoomStat www.mathssupport.org
Modelling with a exponential function Exponential functions can be used to model real world data. The data in the following table list the population of Benin from 1980 through 2019. (Source: https://data.worldbank.org/) Year The general exponential function is: Population (80) 1980 3 717 165 y = abx (85) 1985 4 278 501 From the GDC we get a = 338955 The data can be modelled with the function (90) 1990 4 978 496 b = 1.03 (95) 1995 5 905 558 (100) 2000 6 865 951 y = 338 955(1.03)x The coefficient of determination R2 reveals that 99.9% of the data fit the regression model Drawing the graph (105) 2005 7 982 225 (110) 2010 9 199 259 (115) 2015 10 575 952 (119) 2019 11 801 151 ZOOM 9 ZoomStat www.mathssupport.org
Modelling with a exponential function Exponential functions can be used to model real world data. The data in the following table list the population of Benin from 1980 through 2019. (Source: https://data.worldbank.org/) Year Estimate the population of Benin in 1997. CALC Population (80) 1980 3 717 165 (85) 1985 4 278 501 1:ValueType 97 2nd TRACE (90) 1990 4 978 496 (95) 1995 5 905 558 (100) 2000 6 865 951 (105) 2005 7 982 225 (110) 2010 9 199 259 (115) 2015 10 575 952 (119) 2019 11 801 151 www.mathssupport.org
Modelling with a exponential function Exponential functions can be used to model real world data. The data in the following table list the population of Benin from 1980 through 2019. (Source: https://data.worldbank.org/) Year Estimate the population of Benin in 1997. CALC Population (80) 1980 3 717 165 (85) 1985 4 278 501 1:ValueType 97 2nd TRACE ENTER (90) 1990 4 978 496 (95) 1995 5 905 558 (100) 2000 6 865 951 (105) 2005 7 982 225 (110) 2010 9 199 259 (115) 2015 10 575 952 (119) 2019 11 801 151 www.mathssupport.org
Modelling with a exponential function Exponential functions can be used to model real world data. The data in the following table list the population of Benin from 1980 through 2019. (Source: https://data.worldbank.org/) Year Estimate the population of Benin in 1997. CALC Population (80) 1980 3 717 165 (85) 1985 4 278 501 1:ValueType 97 2nd TRACE ENTER (90) 1990 4 978 496 (95) 1995 5 905 558 The population of Benin in 1997 was approximately 6 198 189. (100) 2000 6 865 951 (105) 2005 7 982 225 (110) 2010 9 199 259 (115) 2015 10 575 952 (119) 2019 11 801 151 www.mathssupport.org
Thank you for using resources from A close up of a cage Description automatically generated For more resources visit our website https://www.mathssupport.org If you have a special request, drop us an email info@mathssupport.org www.mathssupport.org