Finance Report April 2022 Executive Summary
Review the financial performance for April 2022, including EBITDA, cost improvement plan, income statement analysis, and future projections. Gain insights into COVID-19 costs, agency expenditures, and capital investment plans.
Download Presentation

Please find below an Image/Link to download the presentation.
The content on the website is provided AS IS for your information and personal use only. It may not be sold, licensed, or shared on other websites without obtaining consent from the author.If you encounter any issues during the download, it is possible that the publisher has removed the file from their server.
You are allowed to download the files provided on this website for personal or commercial use, subject to the condition that they are used lawfully. All files are the property of their respective owners.
The content on the website is provided AS IS for your information and personal use only. It may not be sold, licensed, or shared on other websites without obtaining consent from the author.
E N D
Presentation Transcript
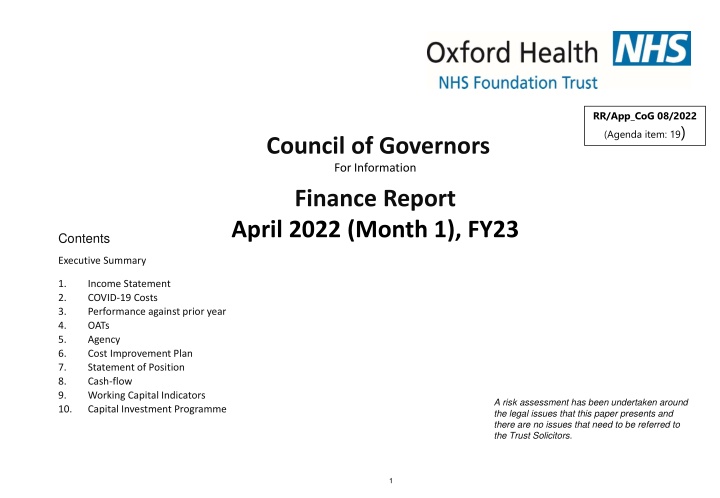
RR/App_CoG 08/2022 (Agenda item: 19) Council of Governors For Information Finance Report April 2022 (Month 1), FY23 Contents Executive Summary 1. 2. 3. 4. 5. 6. 7. 8. 9. 10. Income Statement COVID-19 Costs Performance against prior year OATs Agency Cost Improvement Plan Statement of Position Cash-flow Working Capital Indicators Capital Investment Programme A risk assessment has been undertaken around the legal issues that this paper presents and there are no issues that need to be referred to the Trust Solicitors. 1
Executive Summary EBITDA performance I&E performance Cost Improvement Plan Cash Month 1 1.5m surplus, 0.3m adverse to plan 0.7m surplus, 0.2m adverse to plan 0.3m, 0.4m adverse to plan 84.6m, breakeven to plan The month 1 I&E position is a 0.7m surplus, 0.2m adverse to plan. EBITDA is a 1.5m surplus, 0.3m adverse to plan. The FY23 plan would have been for a breakeven position, however, the plan submitted to NHSE is for 9.2m deficit due to two outstanding contractual issues: - with NHSE Spec Comm ( 3.5m) and BOB MHIS ( 5.7m). I&E is 0.2m adverse to plan driven by under delivery of CIP 0.4m, continuation of high level of agency and contracted OAPS (c. 1.6m) both reported as Covid spend in FY22, partially mitigated by release of covid funding c. 0.6m in expectation of the tapering down of these expenditure items and release of reserves and deferred income, c. 1.2m. The CIP plan for the year is 7.9m with delivery profiled evenly over 12 months. 0.3m has been delivered at month 1, this is 0.4m adverse to plan due to delay in CIP engagement as a result of Covid-19. The closing cash position at the end of April was 84.6m. 2
1. Income Statement INCOME STATEMENT Prior Year Month 1 Year-to-Date YTD Actual M1 Change Plan m 38.3 4.9 43.3 Actual m 38.6 Variance Plan m 38.3 4.9 43.3 Actual m 38.6 Variance m 30.7 5.5 36.2 m 8.0 1.3 9.3 % m 0.3 1.9 2.2 % m 0.3 1.9 2.1 % . 25.9% Clinical Income 23.6% Other Operating Income 25.6% Operating Income, Total 0.0% 0.0% 0.0% 0.7% 38.6% 5.0% 6.8 45.4 6.8 45.4 26.0 9.2 35.2 -3.5 -5.2 -8.7 -13.4% Employee Benefit Expenses (Pay) -56.5% Other Operating Expenses -24.7% Operating Expenses, Total 26.2 15.3 41.5 29.5 14.4 43.9 -3.3 0.9 -2.4 0.0% 0.0% 0.0% 26.2 15.3 41.5 29.5 14.4 43.9 -3.3 0.9 -2.4 -12.5% 5.6% -5.8% 0.0 0.0 0.0% Non-Operational Income 0.0 0.0 0.0 0.0% 0.0 0.0 0.0 0.0% 1.0 0.6 59.9% EBITDA 1.8 1.5 -0.3 0.0% 1.8 1.5 -0.3 -14.9% 0.0 0.6 0.0 0.1 0.1 0.2 0.0 0.1 0.0 0.1 0.0 -0.1 0.0% Profit/(Loss) on asset disposal 16.7% Depreciation and Amortisation 0.0% Asset Impairment 138.9% Interest 0.0% Other Finance Charge -59.5% PDC Dividend 0.0 0.5 0.0 0.1 0.1 0.2 0.0 0.5 0.0 0.0 0.1 0.2 0.0 0.0 0.0 0.0 0.0 0.0 0.0% 0.0% 0.0% 0.0% 0.0% 0.0% 0.0 0.5 0.0 0.1 0.1 0.2 0.0 0.5 0.0 0.0 0.1 0.2 0.0 0.0 0.0 0.0 0.0 0.0 0.0% -1.8% 0.0% 61.7% -1.4% 8.6% 0.0 0.7 0% Surplus/ (Deficit) 0.9 0.7 -0.2 0.0% 0.9 0.7 -0.2 -23.7% The month 1 I&E position is a 0.7m surplus, 0.2m adverse to plan. EBITDA is a 1.5m surplus, 0.3m adverse to plan. Excluding contractual issues with BOB (MHIS) & NHSE (Specialised commissioning) in total 9.2m. The FY23 plan is for a breakeven position which includes 7.9m CIP requirement and a requirement to reduce Covid expenditure by 12.0m as we progress through the year. I&E is 0.2m adverse to plan driven by under delivery of CIP 0.4m, continuation of high level of agency and contracted OAPS (c. 1.6m) both reported as Covid spend in FY22 partially mitigated by release of covid funding c. 0.6m in expectation of the tapering down of these expenditure items and release of reserves and deferred income, c. 1.2m. The CIP plan for the year is 7.9m with delivery profiled evenly over 12 months. 0.3m has been delivered at month 1, this is 0.4m adverse to plan due to delay in CIP engagement as a result of Covid-19. The I&E performance in FY23 is 0.7m better than in FY22 due to deferral of investment income in month 1 of FY22. 3
2. Covid-19 Costs The Trust s retained Covid-19 funding is 9.5m of which 7.3m is retained to support: 1.9m Inpatient cost pressures 1.5m PPE & Testing Team and additional cleaning 3.9m additional ward staffing and OOA beds in line with current spend, tapering down on assumption costs will reduce. the 4
3. Performance against Prior Year The EBITDA position is 0.5m better than last financial year. The significant changes from FY21 are: 1. Block income is 7.1m higher than last year due inflation 0.5m; full year effect of secure and AED provider collaboratives 5.5m; other driven by investments 1.1m. 2. Local Authority income is 0.9m higher than last year due to inflation and Oxfordshire County Council prior year inflation accounted for in FY23. 3. Increase in OPS sales post Covid 0.7m. 4. Permanent staff costs have increased by 1.5m from last year, due to 0.6m FY22 inflation; new costs in Oxfordshire & BSW MH and Buckinghamshire MH directorates as a result of investment in these services last year 0.6m; 0.2m FY23 increase in employers NI, 0.1m across other services. 5. Flexible staff costs have increased by 0.6m from last year, 0.2m each across Oxfordshire & BSW MH, Community and Specialised directorates. 6. Agency staff costs have increased by 1.4m from last year, new costs in Oxfordshire & BSW MH and Buckinghamshire MH directorates as a result of investment in these services last year 1.1m; Other 0.3m including 0.2m Covid-19. 7. Clinical Service & Supplies are 1.1m higher than last year due to the continuing care placements services in the Community directorate. 8. Drugs are 0.7m higher than last year due to higher sales in OPS post Covid-19 9. Premises and Fixed Plant costs are 0.9m higher than last year due to a category change with Secondary Commissioning costs. 10.Purchase of Healthcare 2.5m higher than last year due to provider collaborative in particular full year effect of Secure and change in lead provider payment regime. 7
4. Out of Area Treatments (OATs) OATs are 485k overspent at month 1 ( 447k overspend in Oxfordshire and 38k overspend in Buckinghamshire). This includes the costs of a 16 bed contract with Elysium Potter Bar, that was recharged to COVID in FY22. An a additional 5 Beds that Oxon hold on another Contract with Elysium Chadwick Lodge. 8
5. Agency Temporary Staffing as % Total Pay Spend Temporary Staffing Spend Bank as % of Total pay Agency as % of Total pay Agency Actuals Bank Actuals Total Temp Staffing Actuals 27.00% 7,200,000.00 6,200,000.00 22.00% 5,200,000.00 17.00% 4,200,000.00 3,200,000.00 12.00% 2,200,000.00 7.00% 1,200,000.00 200,000.00 2.00% At month 1 4.3m has been spent on agency staff, which is 15.2% of total staff costs. This includes 1.3m of agency spend in the Covid- 19 vaccination centres. Note that the graphs above exclude spend in the Covid-19 vaccination centres to show a normalised position. Please refer to the HR report for further details. 13
6. Cost Improvement Plan CIP / PIP Delivery at Month 01 FY23 FY FY Plan '000 3,144 1,345 YTD Plan '000 661 YTD Actual '000 YTD Variance '000 Forecast Variance '000 -5,896 1,309 Forecast Target '000 7,929 Projects '000 2,033 1,309 CIP Programme PIP Schemes / Agency Reduction Covid Costs Reduction Total 169 109 -491 109 0 0 0 0 0 0 0 0 0 7,929 4,490 661 279 -382 3,342 -4,587 The FY23 CIP Target is 7.9m phased evenly across FY23. The savings as at the end of month 1 are 0.3m: 0.2m corporate efficiencies; 0.1m IQRA programme. The YTD and forecast savings are 0.4m & 4.6m adverse to target respectively. The primary reason for this is delay in CIP engagement due to Covid. 26
7. Statement of Financial Position Statement of Financial Position as at 30th April 2022 Movement 31 March 2022 Month 13 Month 1 FY23 Year to date In FY22 1. Non-current assets have decreased by 0.6m in-monthdue largely due to the in-month depreciation charge. month '000 '000 '000 '000 '000 2. Trade and other receivables have increased by 5.6m in month in line with net cash inflows, 2.9m in prepayments and 3.7m in accrued income. Non-current assets Intangible Assets Property, plant and equipment Trade and other receivables 6,390 155,907 6,390 155,907 6,093 155,627 (298) (280) (298) (280) 3. Cash has decreased by 4.9m. Most of this, 4.5m, can be attributed the payment capital creditors brought forward from FY22. 487 487 499 12 12 (566) 162,784 Total non-current assets 162,784 162,219 (566) 4. Trade and other payables have decreased by 2.8m in the month. The decrease is in line with the net cash outflows and is due mainly to a decrease in payables and accruals of 2.3m. Current Assets Inventories Trade and other receivables Non-current assets held for sale Cash and cash equivalents Total current assets 2,003 19,702 2,003 19,702 1,731 25,330 (272) 5,628 (272) 5,628 0 (4,939) 416 0 0 0 5. Deferred income has increased marginally in M1 by 0.1m. 89,517 111,223 89,517 111,223 84,578 111,639 (4,939) 416 6. Borrowings have decreased by 50k in the month in line with the expected decrease in the Trust s PFI liability. Current Liabilities Trade and other payables Borrowings Other financial liabilities Provisions Deferred income (75,128) (2,817) (75,128) (2,817) (72,315) (2,870) (1,788) (2,476) (22,911) 2,813 (53) (1,788) 2,813 (53) (1,788) (3) (127) 7. The 0.7m in-year increase in the I&E reserve reflects the Trust s reported surplus in month. 0 (2,473) (22,784) (2,473) (22,784) (3) (127) (103,203) Total Current Liabilities (103,203) (102,361) 842 842 Non-current Liabilities Trade and other payables Borrowings Provisions Other Liabilities Total non-current liabilities Total assets employed 0 0 0 0 (15,784) (4,524) (1,132) (21,440) 149,364 (15,784) (4,524) (1,132) (21,440) 149,364 (15,734) (4,548) (1,132) (21,414) 150,083 50 50 (24) 0 26 719 (24) 0 26 719 Financed by (taxpayers' equity) Public Dividend Capital Revaluation reserve Other reserves Income & expenditure reserve 107,619 27,469 107,619 27,469 107,619 27,471 1 1 0 1 1 0 0 0 14,276 14,276 14,993 717 717 149,364 Total taxpayers' equity 149,364 150,083 720 720 27
8. Cash Flow Summary Notes STATEMENT OF YEAR TO DATE CASH FLOWS The cash flow movements are consistent with the comments made on the Statement of Financial Position. Month 1 FY23 Actual '000 Plan '000 Variance '000 The closing cash position at Month 1 was 84.6m. Cash flows from operating activities Operating surplus/(deficit) from continuing operations 1,023 54 969 Operating surplus/(deficit) from discontinuing operations 0 0 0 Operating surplus/(deficit) 1,023 54 969 Non-cash income and expense: Depreciation and amortisation Impairments and profit on disposal of assets Income recognised in respect of capital donations (cash and non-cash) (Increase)/Decrease in Trade and Other Receivables (Increase)/Decrease in Inventories Increase/(Decrease) in Trade and Other Payables Increase/(Decrease) in Deferred Income Increase/(Decrease) in Provisions Other Movements in Operating Cashflows NET CASH GENERATED FROM/(USED IN) OPERATIONS 503 950 (447) 0 0 0 0 0 0 (5,772) 272 1,279 1,915 1,748 281 (2,579) (500) (7,519) (9) 3,858 2,415 27 0 0 0 27 0 (753) (47) (706) Cash flows from investing activities Interest received Purchase of Non Current Assets Sale of PPE Net cash generated from/(used in) investing activities 49 23 26 253 (4,236) (4,489) 0 0 0 (4,187) (4,466) 279 Cash flows from financing activities Public dividend Capital Received Loans received Loans repaid Capital element of lease rental payments Capital element of Private Finance Initiative Obligations Interest paid Interest element on leases Interest element of Private Finance Initiative obligations PDC Dividend paid Net cash generated from/(used in) financing activities 0 0 0 0 0 0 0 0 0 0 0 (445) 445 0 0 0 (0) (0) 21 0 0 0 (21) 0 0 0 0 (0) (466) 466 (4,939) 89,517 84,578 (4,979) 89,517 84,539 39 0 39 Increase/(decrease) in cash and cash equivalents Cash and Cash equivalents at 1st April Cash and Cash equivalents at 30th April 28
9. Working Capital Indicators Working Capital Ratios Ratio Target Actual Risk Status Debtor Days 30 37 Debtors % > 90 days 5.0% 18.2% Creditor Days 30 46 BPPC NHS - Value of Inv's pd within target (ytd) 95.0% 97.4% BPPC Non-NHS - Value of Inv's pd within target (ytd) 95.0% 83.9% Cash ( m) 72.0 84.6 Summary Notes Debtor days at month 1 below target. Debtors % over 90 days below target due to overdue invoices: NHSE 451k, Ox CCG 443k The Creditor days position is below plan due to high level of accruals for NHS and Non-NHS suppliers and the impact of the BPPC figures NHS BPPC is above target in M1 Non-NHS BPPC is below target in M1 Cash is better than target, as outlined in section 7 and 8. 29
10. Capital Investment Programme Committed '000 1,117 6,474 8,972 9,903 Notes Estates & IM&T Committed FY23 Projects Project c/f Warneford Campus GAU (MH Swindon) picu + highfield hdu suite 830 551 Increase cost against plan - RISK Reclaim 5% VAT ( 324k), potential for 20% Residency Status, additional saving 15% ( 810k) Completion Mar 23 EPMA True Colours 431 200 631 300 Medical Equipment c/f Committed Projects FY23 ICS Capital Programme Fund FY23 Shrublands Sale (NBV) Harlow Sale (NBV) Approx (Accrual/VAT reclaim) Total Capital Programme Fund FY23 Available funding 9,900 682 700 1,000 12,282 2,379 Completion of Sale by Mar 23 Completion of Sale by Mar 23 Approx Figure Potential Revenue Costs Digital Aspirants - Match Funding Enabling Digital Infrastructure - Match Funding End User Devices - Match Funding Networks - Match Funding Project c/f IM&T (tablets) Integration 1,000 300 385 327 300 140 2,452 UTF Match Funding UTF Match Funding UTF Match Funding UTF Match Funding The FY23 draft capital plan totals 12.2m. The detailed capital plan is currently at the approval stage with Exec s and CPSC. 30
