Frequency, Histograms, and Descriptive Analysis
This content covers the concepts of frequency, histograms, and descriptive analysis in statistics. Learn how to create frequency tables, histograms, interpret histograms, and make cumulative frequency tables. Understand the graphical representation of data using histograms and how to analyze data distribution. Dive into practical problems to apply these concepts effectively.

Download Presentation

Please find below an Image/Link to download the presentation.
The content on the website is provided AS IS for your information and personal use only. It may not be sold, licensed, or shared on other websites without obtaining consent from the author.If you encounter any issues during the download, it is possible that the publisher has removed the file from their server.
You are allowed to download the files provided on this website for personal or commercial use, subject to the condition that they are used lawfully. All files are the property of their respective owners.
The content on the website is provided AS IS for your information and personal use only. It may not be sold, licensed, or shared on other websites without obtaining consent from the author.
E N D
Presentation Transcript
12-2 Frequency and Histograms
Frequency: the number of data values in that interval Frequency Table: groups a set of data values into intervals and shows the frequency for each interval Intervals in frequency tables do not overlap, do not have any gaps, and are usually of equal size!
Problem 1: Making a Frequency Table The numbers of home runs by batters in a local home run derby are listed below. What is the frequency table that represents the data? 7, 17, 14, 2, 7, 9, 5, 12, 3, 10, 4, 12, 7, 15
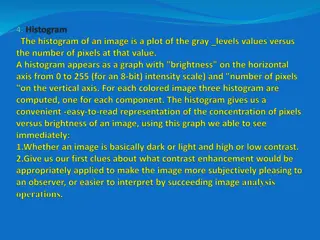
Histogram: A graph that can display data from a frequency table. A histogram has one bar for each interval. The height of each bar shows the frequency data in the interval it represents. No GAPS between bars. Bars are usually equal width.
Problem 2: Making a Histogram The data below are the numbers of hours per week a group of students spent watching television. What is a histogram that represents the data? 7, 10, 1, 5, 14, 22, 6, 8, 0, 11, 13, 3, 4, 14, 5
Problem 3: Interpreting Histograms Is the histogram uniform, symmetric, or skewed?
Cumulative Frequency Table: shows the number of data values that lie in or below a given interval.
Problem 4: Making a Cumulative Frequency Table The number of text messages sent on one day by different students are shown below. What is a cumulative frequency table that represents the data? 17, 3, 1, 30, 11, 7, 1, 5, 2, 39, 22, 13, 2, 0, 21, 1, 49, 41, 27, 2, 0