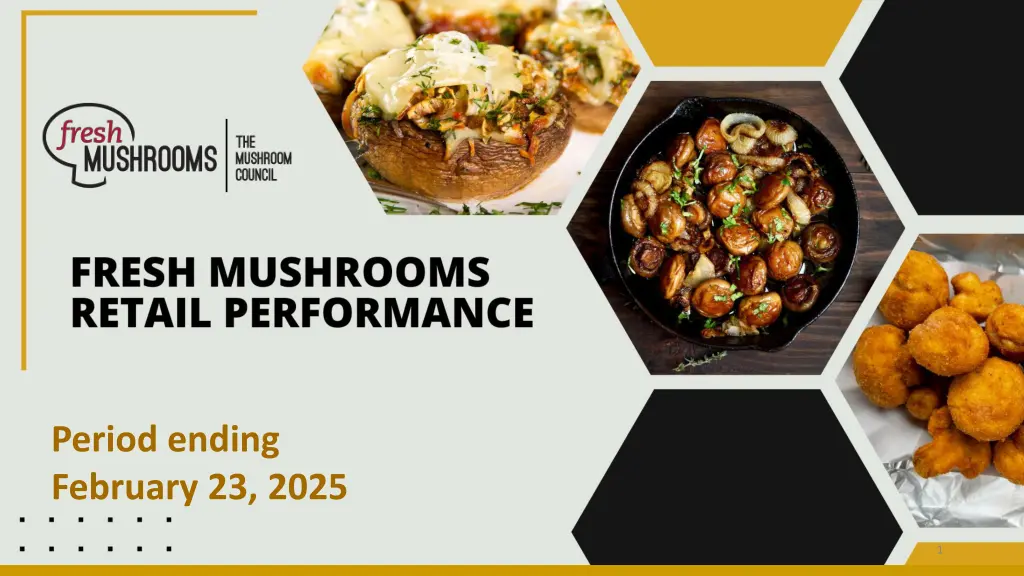
Fresh Mushroom Sales Trends Analysis
Explore the latest fresh mushroom sales trends covering the four weeks ending February 23, 2025. Discover insights on dollar sales, unit sales, volume sales, and mushroom's contribution to the produce department. Contact Anne-Marie Roerink for more information.

Download Presentation

Please find below an Image/Link to download the presentation.
The content on the website is provided AS IS for your information and personal use only. It may not be sold, licensed, or shared on other websites without obtaining consent from the author. If you encounter any issues during the download, it is possible that the publisher has removed the file from their server.
You are allowed to download the files provided on this website for personal or commercial use, subject to the condition that they are used lawfully. All files are the property of their respective owners.
The content on the website is provided AS IS for your information and personal use only. It may not be sold, licensed, or shared on other websites without obtaining consent from the author.
E N D
Presentation Transcript
Period ending February 23, 2025 1
Methodology The report covers the four weeks ending February 23, 2025 with week endings: February 2, 2025 February 9, 2025 February 16, 2025 February 23, 2025 Dollar references are the retail value, volume is reflected in pounds and units (packages) Package size, organic, fixed/random weight and value-added now all reflect the MULO+ expanded marketplace For questions, contact Anne-Marie Roerink, at aroerink@210analytics.com Source: Circana, Integrated Fresh, MULO+, 4 weeks ending 2/23/2025 2
Four-year dollar sales trend Quad-week sales were down almost $10 million from three years ago Fresh mushrooms dollar sales latest 52 w.e. 2/23/2025 Fresh mushrooms dollar sales four w.e. 2/23/2025 $127,334,163 $127,215,960 $124,622,459 $1,574,555,586 $1,566,851,160 $1,541,746,696 $118,013,279 $1,505,831,790 3YA 2YA YA Latest 4 weeks 3YA 2YA YA Latest 52 weeks Source: Circana, Integrated Fresh, MULO+, 4 weeks and 52 w.e. 2/23/2025 versus same periods the past four years 3
Four-year unit sales trend Unit sales have declined by about 64 million packages over the years, but a shift to larger packages have made up some of the lost pounds Fresh mushrooms unit sales four w.e. 2/23/2025 Fresh mushrooms unit sales latest 52 w.e. 2/23/2025 562,891,618 44,312,433 524,869,059 42,030,169 513,315,068 41,080,948 499,306,148 39,953,905 3YA 2YA YA Latest 4 weeks 3YA 2YA YA Latest 52 weeks Source: Circana, Integrated Fresh, MULO+, 4 weeks and 52 w.e. ending 2/23/2025 versus same periods the past four years 4
Four-year volume (pound) sales trend Pound sales have fallen by about 41 million compared to three years ago Fresh mushrooms volume sales latest 52 w.e. 2/23/2025 Fresh mushrooms volume sales four w.e. 2/23/2025 373,767,378 29,417,146 348,674,188 28,027,526 340,731,730 27,279,684 332,644,432 26,574,807 3YA 2YA YA Latest 4 weeks 3YA 2YA YA Latest 52 weeks Source: Circana, Integrated Fresh, MULO+, 4 weeks and 52 w.e. ending 2/23/2025 versus same periods the past four years 5
Mushroom contribution to the department/category The mushroom share of fresh produce and total vegetables averages 3%-4% 4 weeks Mushroom $ share Share of total produce Share of total vegetables 52 weeks Mushroom $ share Share of total produce Share of total vegetables 3YA 3YA 1.9% 4.0% 1.9% 3.9% 2YA 2YA 1.9% 3.8% 1.8% 3.7% YA YA 1.8% 3.7% 1.7% 3.6% 4 w.e. 2/23/2025 52 w.e. 2/23/2025 1.6% 3.5% 1.6% 3.4% Source: Circana, Integrated Fresh, MULO+, 4 weeks and 52 w.e. ending 2/23/2025 6
Mushrooms price per unit On a per unit basis, vegetable and mushroom prices decreased in the quad week 4 weeks Average price/unit Total produce Total vegetables Mushrooms 3YA $2.67 $2.31 $2.87 2YA $2.74 $2.48 $3.03 YA $2.79 $2.47 $3.03 4 w.e. 2/23/2025 $2.80 | +0.3% $2.43 | -1.5% $2.95 | -2.6% Source: Circana, Integrated Fresh, MULO+, YTD weeks ending 2/23/2025 7
Mushroom price per volume (pound) On a per pound basis, total produce, vegetables and mushrooms became less expensive for the consumer 4 weeks Average price/pound Total produce Total vegetables Mushrooms 3YA $1.90 $1.92 $4.32 2YA $1.96 $2.06 $4.54 YA $1.98 $2.05 $4.57 4 w.e. 2/23/2025 $1.98 | -0.3% $2.00 | -2.4% $4.44 | -2.8% Source: Circana, Integrated Fresh, MULO+, YTD weeks ending 2/23/2025 8
Price per volume by quarter/month The quad-week price per volume was the lowest since Q2 2022 Mushrooms price per pound and change vs. YA (fixed and random weight) $4.70 10.0% $4.56 $4.54 $4.56 $4.53 $4.52 $4.57 $4.53 $4.48 $4.51 $4.54 $4.60 8.0% $4.44 $4.44 $4.50 $4.33 $4.40 6.0% 7.9% 7.9% $4.30 6.4% 5.2% $4.09 $4.18 3.5% 4.0% $4.20 4.5% $4.10 2.0% $3.95 $4.00 2.1% 1.0% 1.3%1.0% 0.0% $3.90 0.7% -0.1% -0.5% $3.80 -2.0% -0.8% $3.70 -2.8% $3.60 -4.0% 2019 2020 2021 Q1 22 Q2 22 Q3 22 Q4 22 Q1 23 Q2 23 Q3 23 Q4 23 Q1 24 Q2 24 Q3 24 Q4 24 4 w.e. 2/23/25 Source: Circana, Integrated Fresh, MULO+, 2019-w.e. 2/23/2025 9
Price by type 4 w.e.2/23/2025 Price per unit % change vs. YA Total mushrooms $2.95 -2.6% White mushrooms $2.62 -2.3% Crimini mushrooms $3.36 -2.4% Portabella mushrooms $2.51 -5.3% Specialty mushrooms $5.36 +0.3% 4 w.e. 2/23/2025 Price per volume % change vs. YA Total mushrooms $4.44 -2.8% White mushrooms $3.94 -3.1% Crimini mushrooms $4.51 -1.7% Portabella mushrooms $5.02 -5.0% Specialty mushrooms $14.20 +0.4% Specialty mushrooms include shiitake, oyster, enoki, chanterelle, morel, wood ear, porcini, black forest, lion s mane and other Source: Circana, Integrated Fresh, MULO+, 4 w.e. 2/23/2025 10
Mushroom dollar, unit, volume sales The quad-week was impacted by the date cut-off and showed larger declines than we have seen in recent months 4 w.e. 2/23/2025 dollars $118.0M -5.3% -2.7% -2.6% Dollar Unit Volume growth vs. YA growth vs. YA growth vs. YA volume (lbs) 26.6M -7.2% vs. 3YA -9.7% vs. 3YA -9.8% vs. 3YA Source: Circana, Integrated Fresh, MULO+, 4 weeks ending 2/23/2025 11
Vegetables and mushroom pound sales vs. YA Vegetable growth rates resumed after a flat quad-week 13 performance Volume (pound) sales versus year ago Fresh vegetables vs YA Fresh mushrooms vs. YA 19.0% 15.5% 3.9% 2.8% 2.2% 1.6% 1.3% 1.3% 1.0% 0.3% -0.7% -1.2% -2.3% Q3 '22 -1.0% Q2 '22 2020 2021 Q1 '22 Q4 '22 Q1 '23 Q2 '23 Q3 '23 Q4 '23 Q1 '24 Q2 '24 Q3' 24 Q4 '24 4 w.e. 2/23/25 -1.4% -1.6%-2.5% -2.0% -2.1% -3.6% -2.9% -2.6% -4.4% -5.2% -4.6% -4.0% -4.8% -7.3% -9.1% -8.6% Source: Circana, Integrated Fresh, MULO+, 2020 -w.e. 2/23/2025 12
Share of dollars sold on merchandising Promotional levels increased during the past four weeks affecting the price per pound and unit Fresh mushrooms 4 w.e. Vs. YA Latest 52 w.e. 2/23/2025 Vs. YA 2/23/2025 Share of dollars sold on promotion 17.6% +5.4% 18.3% +4.7% * Any merchandising, including feature, display, feature & display and temporary price reductions Source: Circana, Integrated Fresh, MULO+, latest 4 w.e. 2/23/2025 13
Over indexing versus under indexing regions Volume grew for the Great Lakes and was close to year ago in the Plains Use as comparison to understand importance/size of mushrooms L-4 w.e. 2/23/2025 Share of veg. lbs Share of mushroom lbs lbs sales WEST WEST PLAINS PLAINS growth vs. YA GREAT LAKES GREAT LAKES Total US California Great Lakes Mid-South Northeast Plains South Central Southeast West 100.0% 10.8% 14.5% 13.5% 15.8% 7.1% 10.4% 15.3% 12.7% 100.0% 12.4% 15.0% 12.0% 17.5% 6.4% 7.6% 15.2% 14.0% -2.6% -4.5% +0.6% -2.2% -3.6% -0.9% -3.0% -4.5% -1.6% NORTHEAST NORTHEAST MID SOUTH MID SOUTH CALIFORNIA CALIFORNIA SOUTHEAST SOUTHEAST SOUTH CENTRAL SOUTH CENTRAL = Above-average share vs. veg = Above-average performance vs. total US Source: Circana, Integrated Fresh, MULO+, L52 w.e. 2/23/2025 | Total fresh vegetables and total fresh mushrooms 14
Performance summary whites, browns and specialty Whites had the strongest performance this quad week but all varieties lost ground Dollar share $ sales vs. $ sales vs. 3YA Volume (lbs) Lbs Lbs Lbs vs. 3YA 4 weeks ending 2/23/2025 Dollars YA share vs. YA $118M 100.0% -5.3% -7.2% 26.6M 100.0% -2.6% -9.7% Total fresh mushrooms $58.6M 49.7% -4.0% -10.1% 14.9M 55.9% -0.9% -12.7% White mushrooms $42.4M 35.9% -6.5% -0.1% 9.4M 35.4% -4.9% -2.6% Crimini mushrooms $8.6M 7.3% -7.7% -26.0% 1.7M 6.5% -2.8% -19.7% Portabella mushrooms $7.1M 6.0% -4.2% +6.0% 0.5M 1.9% -4.6% +0.7% Specialty mushrooms Source: Circana, Integrated Fresh, MULO+, 4 weeks ending 2/23/2025 15
Other insights Packaged (fixed weight) versus random weight Package-size analysis Organic versus conventional Value-added versus whole/uncut 16
Package size analysis 8-ounce packs drove the bulk of sales but 24-ounce packages grew dollar, unit and volume sales in the quad-week Package size (per UPC) 52 weeks Dollars $ vs. YA Units % vs. YA Volume lbs vs. YA 8 OZ $724.4M -2.8% 311.7M -2.2% 155.8M -2.2% 16 OZ $233.8M -3.5% 57.9M -5.1% 57.9M -5.1% 24 OZ $245.1M +2.3% 47.7M +1.7% 71.6M +1.7% Source: Circana, Integrated Fresh, MULO+, 52 weeks ending 2/23/2025 17
Packaged (fixed weight) versus random weight Fixed-weight dollar sales outperformed random weight 4 w.e. 2/23/2025 | Share of total mushroom sales and sales growth % Fixed weight Random weight Dollar growth -5.0% -14.0% Share of mushroom $ sales 96.8% -2.4% 3.2% -7.3% Volume growth Share of mushroom lbs sales 97.1% 2.9% Source: Circana, Integrated Fresh, MULO+, 4 weeks ending 2/23/2025 18
Organic versus conventional mushrooms sales Organic mushrooms increased volume sales with a shift to larger pack sizes 4 w.e. 2/23/2025 | Share of total mushroom sales and sales growth % Unit growth -3.4% Volume growth -3.9% Market size $90.3M $ Conventional growth -7.2% Unit growth +1.3% Volume growth +2.8% Market size $27.7M $ Organic growth +1.4% Source: Circana, Integrated Fresh, MULO+, 4 weeks ending 2/23/2025 compared with year ago 19
Value added versus whole mushrooms Whole outperformed value-added mushrooms, though both areas were down 52 w.e. 2/23/2025 | Share of total mushroom sales and sales growth % Unit growth -1.6% Volume growth -1.8% Market size $885M $ Whole growth -1.3% Unit growth -4.3% Volume growth -3.3% Market size $621M $ growth -3.7% Value-added Source: Circana, Integrated Fresh, MULO+, 52 weeks ending 2/23/2025 compared with year ago 20


 sales trend")


")


 versus random weight")