Gender Pay Gap Report in Hospitals Limited 2024
Discover insights from the Gender Pay Gap Report at Hospitals Limited 2024, highlighting the differences in earnings between men and women, workforce proportion, bonus distribution, mean and median pay gaps, and strategies to promote diversity and equality in the workplace.
Uploaded on | 0 Views
Download Presentation

Please find below an Image/Link to download the presentation.
The content on the website is provided AS IS for your information and personal use only. It may not be sold, licensed, or shared on other websites without obtaining consent from the author. If you encounter any issues during the download, it is possible that the publisher has removed the file from their server.
You are allowed to download the files provided on this website for personal or commercial use, subject to the condition that they are used lawfully. All files are the property of their respective owners.
The content on the website is provided AS IS for your information and personal use only. It may not be sold, licensed, or shared on other websites without obtaining consent from the author.
E N D
Presentation Transcript
Gender Pay Gap Report Hospitals Limited 2024 1
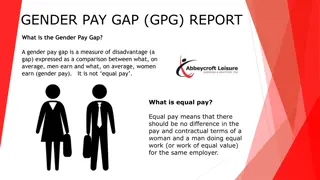
Gender Pay Gap Report Our colleagues are passionate about creating an exceptional experience for patients, and we are dedicated to delivering the highest standards of quality and safety. We cannot do this without a workforce that is diverse and inclusive. The gender pay gap shows the difference between the average (mean or median) earnings of men and women. The mean is the average and the median is the middle number when hourly rates are placed in order from lowest to highest; both calculations are expressed as a percentage of male earnings. Equal pay is not the same as the gender pay gap; it deals with pay discrimination and the differences in pay when members of the opposite sex are paid differently but yet they carry out the same work, similar work or work of equal value. We are committed to supporting equality through fair pay and we strive to ensure that men and women are paid equally for doing equal work. PROPORTION OF WORKFORCE PROPORTION RECEIVING A BONUS 77% 23% 10.6% 15.8% 2
Gender Pay Gap Report Mean Pay Median Pay 100.00 70.00 60.00 80.00 50.00 60.00 40.00 40.00 30.00 20.00 20.00 0.00 10.00 Non Medical Medical Combined 0.00 Non Medical Medical Combined Male Female Male Female Type Non Doctors 18.3% 21.6% Doctors -2.2% 1.2% Combined 40.6% 24.6% Mean gender pay gap Median gender pay gap 3
Gender Pay Gap Report Mean Bonus Median Bonus 12000.00 3,000.00 10000.00 2,500.00 8000.00 2,000.00 6000.00 1,500.00 4000.00 1,000.00 2000.00 500.00 0.00 0.00 Non Medical Medical Combined Non Medical Medical Combined Male Female Male Female Type Non Doctors 45.7% Doctors -311.2% -75.9% Combined 36.9% Mean bonus gender pay gap Median bonus gender pay gap 0% 0% 4
Gender Pay Gap Report PAY QUARTILES Upper Middle Quartile Split Lower Quartile Split Lower Middle Quartile Split Upper Quartile Split 12% 24% 15% 40% 60% 85% 76% 88% Hourly Rate Range: 23.70+ Hourly Rate Range: 12.61 to 17.98 Hourly Rate Range: 17.98 to 23.68 Hourly Rate Range: 11.44 to 12.61 Salary Range: 46215 Salary Range: 24589.50 to 35061 Salary Range: 35061 to 46176 Salary Range: 22308 to 24589.50 WHAT DO OUR RESULTS SHOW? The proportion of males and females hasn t altered significantly since last year however the proportion of males and females within the quartiles has shifted alongside the total number of employees included in the reporting this year The Lower Middle quartile has had a 4% reduction in males, with the Upper Middle males proportion increasing by 6% with the same proportion reducing in the Upper Quartile. This suggests a shift in the proportion of males working in senior and medical roles, however the Upper quartile still has the highest proportion of men and drives the mean pay gap. The proportion of employees receiving bonus s has significantly reduced from the previous year, with males more likely to receive a bonus than females. Whilst the mean and median medical bonus gap is overwhelmingly positive to females. The non medical and therefore combined mean and median gaps are skewed towards the higher number of male bonus s at higher values. CLOSING THE GAP We are committed to maintaining a diverse and gender balanced workforce and we will continue to promote and celebrate diversity and inclusion within the business and the wider community. We will continue to support women in the business through the offering of women in leadership programmes. We support any action designed to highlight the gaps in pay regardless of how these occur. We will work to ensure that all individuals are given equal opportunity to progress within the business in terms of both pay and progression, regardless of gender.

