Gender Pay Gap Reporting in the UK Theatre Industry
Learn about the Gender Pay Gap reporting requirements in the UK for companies like Ambassador Theatre Group, why it's important, what information gets reported, and the analysis of ATG's 2023 gender pay gap data compared to previous years. Explore the differences between mean and median pay gaps, as well as the focus on promoting equal opportunities and diversity within organizations.

Download Presentation

Please find below an Image/Link to download the presentation.
The content on the website is provided AS IS for your information and personal use only. It may not be sold, licensed, or shared on other websites without obtaining consent from the author. If you encounter any issues during the download, it is possible that the publisher has removed the file from their server.
You are allowed to download the files provided on this website for personal or commercial use, subject to the condition that they are used lawfully. All files are the property of their respective owners.
The content on the website is provided AS IS for your information and personal use only. It may not be sold, licensed, or shared on other websites without obtaining consent from the author.
E N D
Presentation Transcript
Ambassador Theatre Group UK Gender Pay Gap Reporting the basics March 2024 For Internal Use Only
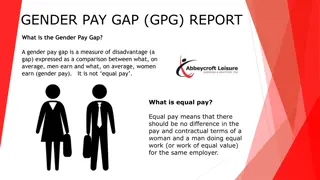
ATG ATG Gender Pay Gap Reporting What? Why? Regulations were introduced requiring companies with 250 employees or more in England, Scotland and Wales to publish information regarding their Gender Pay Gap Part of the Government s aim to close the gender pay gap within a generation A good thing for companies to do widely acknowledged that diversity is a key driver to success Gender Pay Gap vs Equal Pay Gender Pay Gap is not the same as Equal Pay. The Gender Pay Gap is the measure of the difference between men s and women s average earnings across the organisation, expressed as a percentage of men s earnings. Insights gained from this report allow us to focus on ways to ensure we offer equal opportunities, progression and pay for our staff, in all functions 7th year of this reporting companies normally need to publish their figures by 4th April 2024. 2 2
ATG ATG Gender Pay Gap Reporting 2023 What gets reported? Gender Pay Gap Pay information reported is a snapshot from April 2023 Reporting is done in aggregate and in pay quartiles per gender Gender Bonus Gap Bonus information includes all payments (including sales commissions, show bonuses and bonuses) made in the preceding 12 months (April 2022-March 2023) Proportion of men and women receiving a bonus Mean vs Median Gaps Mean = average; can be skewed by any outliers at the top or bottom of the sample Median = middle value; looks at the central tendency of the sample Complementary metrics that illustrate different aspects of the pay distribution across the organisation. 3 3
2023 Figures1 to be reported vs. 2022 & 21 ATG ATG Pay Gap Lowest Quartile 3 Quartile 2 Highest 2023 2022 2021 30% 36% 40% 49% 51% ATG Median Gender Pay Gap2 1.7% 1.1% 14.3% 60% 64% 70% ATG Mean Gender Pay Gap3 13.2% 10.4% 21.1% 0% pay gap 0% pay gap 0% pay gap 9.5% pay gap UK Median Gender Pay Gap4 14.3% 14.9% 15.1% To note 1. This reporting period represents qualifying pay from 3,660 people. As this slide contains information that exceeds our statutory reporting requirements, it is for internal use only. 2. Our median Gender Pay Gap is now 1.7%, against a national average of 14.3%. We are back to close to pre-pandemic, 2019 levels. Although this is mostly driven by the fact a large proportion of our workforce is on set pay grades, it also reflects the reality that women are well represented at all levels of our company. We have more women in the company overall, and a nearly equal split of men and women in the top pay quartile. 3. Our mean Gender Pay Gap is 13.2%, slightly up from recent levels. Further analysis shows that there is no gender pay gap in the bottom 3 quartiles of the company, and in fact a gap only starts to appear amongst the top 2% of highest paid employees (e.g. top 57 employees, with a 61-39 male-female split and a 11% mean pay gap). 4 4 4 Office of National Statistics - Gender pay gap in the UK - Office for National Statistics (ons.gov.uk)
2023 Figures1 to be reported vs. 2021 & 22 ATG ATG Bonus Gap Lowest Quartile 3 Quartile 2 Highest 2023 2022 2021 Median Gender Bonus Gap2 0% 10% -108% 38% 41% 44% 49% 51% 56% 59% 62% Mean Gender Bonus Gap3 75.8%/46.2% 55.5% -50% Proportion of Males receiving a Bonus Payment 11.7% 46% 2% 17% mean bonus gap 16% mean bonus gap -8% mean bonus gap 74%/36% mean bonus gap Proportion of Females receiving a Bonus Payment 10.7% 40% 2% To note 1. This reporting period covers all payments (including sales commissions, show bonuses and bonuses) made between April 2022-March 2023. Over this period, 493 people received a qualifying bonus. As this slide contains information that exceeds our statutory reporting requirements, it is for internal use only. 2. The Median gender bonus gap is 0% for this period, for the first time since we started reporting this gap. 3. The Mean gender bonus gap of 75.8% represents an actual cash gap of 848. These figures are skewed by 2 historical restructured share arrangements, which resulted in one-time payments required to be included in this calculation. Excluding these, the mean gender bonus gap becomes 46.2%, which is an improvement on the previous year. Continuing to exclude these payments, further analysis shows that mean bonus gaps in the bottom 3 quartiles range from -8% to 17% (equivalent to 44- 144 cash differentials), growing to 36% in the top quartile. 5 5