Government's Leaked Analysis of Brexit Costs - Implications for Growth and Spending
Labour released the Government's analysis of Brexit costs, showing lower growth paths for different Brexit scenarios like Single Market Membership, Free Trade Agreement, and WTO rules. The estimated foregone GDP and implications for tax and public spending are highlighted, emphasizing the significant difference in GDP between the Single Market Membership and FTA options.

Download Presentation

Please find below an Image/Link to download the presentation.
The content on the website is provided AS IS for your information and personal use only. It may not be sold, licensed, or shared on other websites without obtaining consent from the author. If you encounter any issues during the download, it is possible that the publisher has removed the file from their server.
You are allowed to download the files provided on this website for personal or commercial use, subject to the condition that they are used lawfully. All files are the property of their respective owners.
The content on the website is provided AS IS for your information and personal use only. It may not be sold, licensed, or shared on other websites without obtaining consent from the author.
E N D
Presentation Transcript
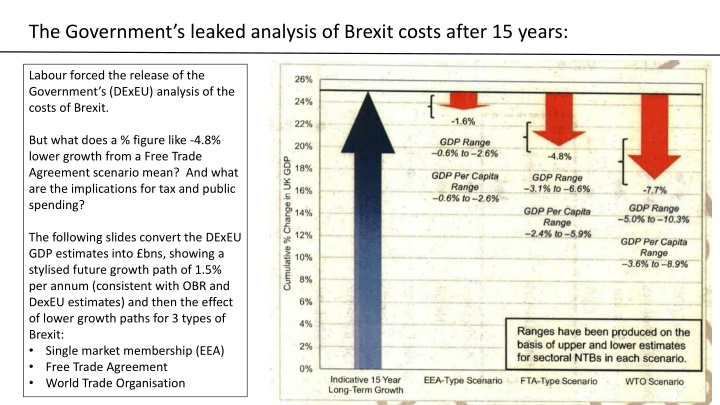
The Governments leaked analysis of Brexit costs after 15 years: Labour forced the release of the Government s (DExEU) analysis of the costs of Brexit. But what does a % figure like -4.8% lower growth from a Free Trade Agreement scenario mean? And what are the implications for tax and public spending? The following slides convert the DExEU GDP estimates into bns, showing a stylised future growth path of 1.5% per annum (consistent with OBR and DexEU estimates) and then the effect of lower growth paths for 3 types of Brexit: Single market membership (EEA) Free Trade Agreement World Trade Organisation
Expressed in s, growth continues, but is lower than might have been. Forecast of GDP in DexEU analysis of three Brexit options: Single market membership (EEA), Free Trade Agreement (FTA), WTO rules. 2015 market prices, bn Normal growth rate is estimated by OBR to be 1.5%. 3,000 To arrive at -7.7% lower growth in 2032 under WTO rules implies an average annual growth rate of 0.939%. 2,500 2,000 1,500 FTA type Brexit implies annual growth of 1.148%. 1,000 EEA type Brexit implies annual growth rate 1.371%. 500 "Remain" EEA FTA WTO - 2017 2018 2019 2020 2021 2022 2023 2024 2025 2026 2027 2028 2029 2030 2031 2032
E.g. a Free Trade Agreement leads to foregone GDP of over 100bn pa by 2032 Foregone GDP, under EEA, FTA and WTO -type Brexits bn per annum, 2015 market prices Labour, of course, would not contemplate a no deal / WTO type Brexit. 2017 2018 2019 2020 2021 2022 2023 2024 2025 2026 2027 2028 2029 2030 2031 2032 - 20 40 Instead the choice is between some form of single market membership and FTA. 60 80 100 120 140 The next slide draws out the difference between those two options. 160 180 200 EEA FTA WTO
Labour has a choice of supporting single market membership or an FTA: the difference between these options is c. 80bn p.a. in foregone GDP by 2032 Foregone GDP - the difference between the Single Market membership option (EEA) and a Free Trade Agreement. bn, 2015 market prices, per annum. 2017 2018 2019 2020 2021 2022 2023 2024 2025 2026 2027 2028 2029 2030 2031 2032 - 10 20 30 40 50 60 70 80
Adding up each years foregone GDP: the cumulative total over 15 years is c. 600bn difference between single market membership and an FTA Cumulative GDP foregone over 15 years, bns, 2015 market prices 2017 600 2032 2018 To put this figure in perspective the Labour manifesto promised a National Transformation Fund of 250 billion, to be spent over 10 years, to invest in the UK s infrastructure. 500 2031 2019 400 300 2030 2020 200 100 2029 2021 - 2028 2022 2027 2023 2026 2024 2025
With an FTA foregone tax revenue reaches over 40bn per annum by 2032 Foregone tax revenue from different forms of Brexit bns, 2015 market prices, per annum 2017 2018 2019 2020 2021 2022 2023 2024 2025 2026 2027 2028 2029 2030 2031 2032 0 10 Again, the next slide draws out the difference between single market membership and an FTA. 20 30 40 50 60 70 80 EEA FTA WTO
The choice for Labour: the difference between an FTA and single market membership is nearly 30bn per annum tax revenue foregone by 2032 Foregone tax revenue - the difference between the Single Market membership option (EEA) and a Free Trade Agreement. bn, 2015 market prices, per annum. 2017 2018 2019 2020 2021 2022 2023 2024 2025 2026 2027 2028 2029 2030 2031 2032 0 5 10 15 20 25 30
Foregone tax revenue quickly adds up: cumulative total by 2032: over 200bn difference between single market membership and an FTA Cumulative tax foregone over 15 years, bn 2015 market prices 2017 250 2032 2018 200 2031 2019 150 2030 2020 100 50 2029 2021 0 2028 2022 2027 2023 2026 2024 2025
Notes and assumptions The spreadsheet containing the data and calculations can be found at https://www.nickdonovan.org.uk/npf. I am grateful to four macro-economists for checking the data and calculations, and their helpful comments. I have stressed the difference between an FTA and single market membership, because while Labour has expressed a desire to participate in the EU s internal market, it continues to oppose freedom of movement and express doubts about state aid rules. A bespoke single market membership outside the EEA is probably possible; a bespoke single market membership without a migration policy which the EU recognises as freedom of movement, and without a level playing field on state aid rules, is not possible. One point that I have heard made is that Labour s economic policy and ending austerity, is more important than stopping hard Brexit in reigniting growth. Undoubtedly, investing more in infrastructure and ending public sector spending cuts would help to counter the effects of Brexit. But this is not an either-or situation, and Brexit effects the economy in different ways than austerity. Think of the economy as a plane with four engines. Since the global financial crisis the UK s economy has been operating with 3 engines. (Indeed, for some regions of the UK, the economy has been flying with 1 or 2 engines for decades.) Brexit, which has an immediate effect through the exchange rate and trade, and then a longer-term supply side effect through productivity, removes another engine down to 2. Ending austerity means we d still only be flying with 3 engines. The point is to fly with 4 engines, in all regions of the UK.
Notes and assumptions (2) The Brexit dividend : Following the practice of the OBR (See rows 21 and 22 of Table 4.16, p.138, of the OBR November 2017 Economic and Fiscal Outlook) I have assumed no Brexit dividend from lower payments to the EU. The OBR assume a fiscally neutral reduction in payments to the EU, which, when it ends, translates into more spending on domestic institutions. (E.g. lower contributions to ECHA, the chemical regulator, become expenditure on a domestic UK chemicals regulator). Inflation: values are expressed in constant 2015 prices, to abstract away the effect of inflation (in 2032 the nominal value of GDP will be much higher). The counterfactual of Remain growth being 1.5% is consistent with both the DexEU analysis and the Office of Budget Responsibility central forecast. See Fiscal Sustainability Report, Nov 2017, p.5. Growth is assumed to be constant, of course in practice it is likely to vary. After 15 years, as new trading patterns settle, growth may recover. Other estimates such as NIESR (see next slide) have modelled an earlier shock as trade drops away, followed by more steadily lower growth - this has an effect on cumulative foregone GDP and tax receipts. Tax receipts are assumed to be 37.4% , as used in HMT modelling, p188, of pre referendum Brexit analysis, long term impact. (OBR use 36.6% in their medium term analysis - see table 3.9, p.61 Fiscal Sustainability Report, January 2017.) A future government may well have higher or lower receipts as a % of GDP. This can be adjusted easily in my spreadsheet: higher estimates of future tax receipts as a % of GDP imply greater foregone tax revenue. Receipts are assumed to be constant, however some forms of Brexit may change the composition of GDP such that the effect on receipts is not constant (e.g. a tax-haven economy with more low tax paying tech firms like Google but fewer banks might have similar GDPs but different receipt levels). Also, as growth is in practice not likely to be linear, and this may affect estimates of receipts foregone. Immigration: the DexEU estimates assume lower net migration. Other things being equal, this may lower the 'need' for government spending.
My slides assume a stylised, straight line effect on GDP growth. It needn t be so: for instance, NIESR estimate an early hit to growth as barriers go up, followed by more gradual impact.


")