Impact of Enrollment and Retention on University Budget
Learn how enrollment and retention numbers directly affect a university's budget, with insights on tuition revenue, challenges in budgeting, and historical data on University of Montana's student counts and retention rates.

Download Presentation

Please find below an Image/Link to download the presentation.
The content on the website is provided AS IS for your information and personal use only. It may not be sold, licensed, or shared on other websites without obtaining consent from the author. If you encounter any issues during the download, it is possible that the publisher has removed the file from their server.
You are allowed to download the files provided on this website for personal or commercial use, subject to the condition that they are used lawfully. All files are the property of their respective owners.
The content on the website is provided AS IS for your information and personal use only. It may not be sold, licensed, or shared on other websites without obtaining consent from the author.
E N D
Presentation Transcript
How Enrollment and Retention Affect the University s Budget January 17, 2019 UM Budget Committee
Budgeted Tuition Revenue equals: A projected headcount of new students plus A projected headcount of continuing students (those who are retained or persist ) less A projected headcount of students who will graduate or attrite Even a slight decline in enrollment impacts the balance of the university s budget. Budgeting Challenges: Every student is not equal revenue. Not every student receives a tuition waiver. The latest retention and persistence information is not always available for budgeting. Project based upon single year historical information and future predictions.
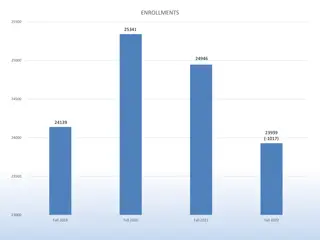
UNIVERSITY OF MONTANA Headcount
UNIVERSITY OF MONTANA Fall Census 2009 2010 2011 2012 2013 2014 2015 2016 2017 2018 First-time Freshman 1,863 1,893 1,711 1,487 1,501 1,597 1,397 1,268 1,292 1,172 Students Retained 1,365 1,402 1,271 1,088 1,081 1,148 973 886 883 Attrition 498 491 440 399 420 449 424 382 409 Fall to Fall Retention Rate 73% 74% 74% 73% 72% 72% 70% 70% 68%
UNIVERSITY OF MONTANA Gross Tuition Revenue Gross Tuition Revenue One Year Gross Tuition Revenue Three Years Rate Students Resident Undergraduate Non Resident Undergrad WUE $ $ $ 5,347 22,990 8,020 (100) (100) (100) (534,700) (2,299,000) $ (802,000) $ (3,635,700) $ $ (1,604,100) $ (6,897,000) $ (2,406,000) $ (10,907,100) $ Tuition revenue only Does not include mandatory or non-mandatory student fees, program tuition, course fees, room and board, etc. or the cost to recruit.
Tuition Waivers as a Percentage of Tuition Resident Undergrads Fall 2018 Resident Tuition Waiver - Undergrad Resident Tuition Waiver - Athletics Community College Honor Scholarship MUS Honor Scholarship National Merit Scholarship -6.35% -1.20% -0.21% -3.20% -0.03% $ (534,700) Gross Tuition Lost X 18.32% = $ 97,957 Discount American Indian Waiver Montana Senior Citizen Waiver Honorably Discharged Veteran Waiver Fee Waiver - Other Resident Dependent Waiver Faculty/Staff Waiver Tuition Waivers as a Percent of Tuition -4.26% -0.13% -0.16% -1.76% -0.64% -0.36% -18.32% $ (436,743) Net Tuition Revenue from 100 Resident Undergraduates Per Year
UNIVERSITY OF MONTANA FY15 Actual $57,055,703 FY16 Actual $55,219,803 FY17 Actual $55,814,140 FY18 Actual $53,862,009 FY19 Budgeted $54,312,912 General State Support Performance Funding - Mountain Campus Performance Funding - Missoula College Total State Support $1,682,882 $4,074,776 $4,074,776 $3,965,729 $3,965,729 $526,095 $818,151 $818,151 $677,803 $580,124 $59,264,680 $60,112,730 $60,707,067 $58,505,541 $58,858,765 Net Tuition Revene $79,056,648 $72,884,915 $71,979,348 $70,972,081 $62,715,326 FY15 FY16 FY17 FY18 FY19 State Support per Resident FTE $ 6,917 $ 7,372 $ 8,013 $ 8,229 $ 8,640
Performance Funding Model Desired Properties Non-competitive between institutions Recognizes noisy (random or non-statistically sig. variation in) data Sliding scale: partial gain/loss (in extreme, includes bonus for exceeding goal) Straightforward (and non-duplicative or compounding) weights across metrics Pre-defined target values Opportunity to make up lost funds Plan for reallocation of residual Regular model review/assessment
3 Steps to Performance Funding 1. Determine the maximum amount of performance funding an institution can receive. 2. Measure the institutional performance on a define set of metrics 3. Allow for grant application to gain back up to 50% of the lost revenue
STEP 1 - Determine the maximum amount of performance funding an institution can receive Eligible amount is based on the three-year average of RESIDENT FTE. Institutional percentage of the system average resident FTE is the dollar share of the performance funding pool Note: There is a timing lag FY15, FY16, FY17 average FTE is used to determine eligible funding for FY18 and FY19
STEP 2 - Measure the institutional performance on a define set of metrics Performance funding metrics are mission specific. Mountain Campus Number of undergraduate degrees awarded (30%) Retention Rate (performance funding defined cohort tracked) (30%) Number of graduate degrees awarded (20%) Research expenditures (20%) Missoula College Number of degrees/certificates awarded (30%) Retention Rates (30%) Dual Enrollment (15%) Remedial Success (12.5%) Credit Accumulation (12.5%) Calculation: Scores are indexed to a 1,000 point scale Growth Target is determined by regents. Institutions are scored and compared to the needed growth target Most recent year of data must show improvement from the 3-year average
STEP 2 - Measure the institutional performance on a define set of metrics FY19 Mountain Campus Allocation Received full eligible amount
STEP 2 - Measure the institutional performance on a define set of metrics FY19 Missoula College Allocation Lost allocation because awards and remedial success did not show improvement and other areas did not improve enough to make up their loss
STEP 3 - Allow for grant application to gain back up to 50% of the lost revenue What happens if institution does not gain enough points to hit the growth target? Eligible amount is pro-rated based on a standard deviation of the last 5-years of total points scored by the institution. Missoula College updated standard deviation = 96.9 Regents allow for some funding as long as total score is within two standard deviations of the growth target. 96.9 * 2 = 193.8 1010 193.8 = 816.2 (minimum score MC needed to get any performance funding The score of 954 is 71% of the distance between the minimum score and growth target; MC receives 71% of the eligible target 193.7= 71.1% 954 816.3 1010 816.3=137.7 Missoula College applied for a grant addressing how they would improve their performance funding metrics and received a portion of the last performance funding back