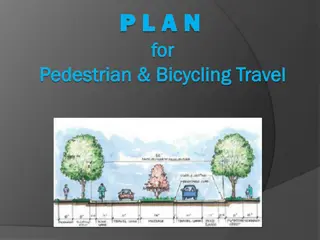
Implementation of NCHRP Research Report 893 in Oregon DOT Pedestrian and Bicycle Plan
Implementing NCHRP Research Report 893 methods to update the 2014 ODOT Pedestrian and Bicycle Safety Implementation Plan. The process and approach are transferable to other agencies looking to enhance pedestrian and bicycle safety. The report outlines a systemic pedestrian safety analysis method, focusing on proactive measures to prevent crashes before they occur. Benefits include cost-effective, data-driven decision-making for low-cost treatments at high-risk locations.

Download Presentation

Please find below an Image/Link to download the presentation.
The content on the website is provided AS IS for your information and personal use only. It may not be sold, licensed, or shared on other websites without obtaining consent from the author.If you encounter any issues during the download, it is possible that the publisher has removed the file from their server.
You are allowed to download the files provided on this website for personal or commercial use, subject to the condition that they are used lawfully. All files are the property of their respective owners.
The content on the website is provided AS IS for your information and personal use only. It may not be sold, licensed, or shared on other websites without obtaining consent from the author.
E N D
Presentation Transcript
NCHRP Project 20 NCHRP Project 20- -44(13) Implementation of NCHRP Research Report 893: The Oregon DOT Statewide Pedestrian and Bicycle Plan 44(13) Kittelson & Associates, Inc. In association with: DKS Associates Chris Monsere, PhD, PE
Project Objective Apply NCHRP Research Report 893 Methods to Update 2014 ODOT Pedestrian and Bicycle Safety Implementation Plan Process and approach may be useful for other DOTs/local agencies looking to address pedestrian and bicycle safety Documented lessons learned and transferability considerations NCHRP Research Report 893 can be implemented in some way by all agencies
Presentation Organization Background Project Approach and Lessons Learned Transferability and Other Considerations and Follow-up Research
NCHRP Research Report 893 Systemic Pedestrian Safety Analysis http://www.trb.org/Publications/Blurbs/178087.aspx Describes a Safety Analysis Method for: Pedestrian Systemic Safety Analyses Considering: Pedestrian Activities/Behavior Roadway Features Other Contextual Risk Factors (e.g., land-use) Identifying Cost-effective Countermeasures Prioritizing Locations
Systemic Safety A Proactive Approach Prevent Crashes Before They Occur Crash Probability, Not History Crash Locations Spread Across a Network Severe Crashes Ped/Bike Crashes Locations are Random, but Contributing Factors Are Predictable
NCHRP Research Report 893 Process Step 1: Define Study Scope Step 7: Evaluate Program and Project Impacts Step 2: Compile Data Step 6: Refine and Implement the Treatment Plan Step 3: Determine Risk Factors Step 4: Identify Potential Treatment Sites Step 5: Select Potential Countermeasures
Systemic Safety Benefits Comprehensive Decision-making Basis Cost-effective Typically Low-cost Treatments at Similar Sites Data-driven Proactive Consistency
ODOT Plan Objectives Final ODOT Plan Provides: Framework for Conducting Systemic Pedestrian and Bicycle Safety Analyses Risk Factors to Identify Locations for Treatments Example Applications and Treatment Options The Plan Does Not Provide: A Project List Results To Be Used in ODOT s HSIP Project Selection Process
Project Scope Task 1 Project Kick-off Confirm Objectives and Work Plan Task 2 Complete Pedestrian Systemic Analysis Propose Methodology for Transferring Method to Bicycle Safety Task 3 Complete Bicycle Systemic Analysis Task 4 Presents Results to/Seek Feedback from ODOT Region and Local Agency Staff (End of Tasks 2 and 3)
Project Scope (continued) Task 5 Develop Performance Measures Task 6 Final NCHRP Report
Project Approach & Lessons Learned
Project Process Step 1: Define Study Scope Step 7: Evaluate Program and Project Impacts Step 2: Compile Data Step 6: Refine and Implement the Treatment Plan Step 3: Determine Risk Factors Step 4: Identify Potential Treatment Sites Step 5: Select Potential Countermeasures
Step 1 Define Study Scope Study Area Jurisdiction, sub-area, etc. Target Facility/Location Types Intersections, segments, functional class, etc. Target Crash Types Pedestrian, bicycle, roadway departure, etc.
Step 1 Define Study Scope Oregon Pedestrian Crash Tree
Step 1 Define Study Scope Oregon Bicycle Crash Tree
Step 1 Define Study Scope ODOT Plan Study Area Statewide Target Facility/Location Types State Highways Emphasis on Urban Areas (population >5,000) Target Crash Types Pedestrian Bicycle
Step 1 Define Study Scope Successes/Challenges Successes Crash Data Format Allowed for Quick Crash Tree Analysis Crash Trees Identified High-level Focus Areas Challenges Sample Size Too Small to Focus on Fatal/Injury A Crashes Crash Trees May Obscure Variations in Patterns E.g., An Urban Area with 7,000 People vs. One with Over 600,000 Balancing Urban and Rural Investment
Step 1 Define Study Scope Lessons Learned Low-frequency/High-severity Bias Areas with Fewer, but More Severe, Crashes May Stand Out Severity of Rural Crashes is Higher, but Much Lower Frequency Locations Defined as Urban Contextually Vary
Step 2 Compile Data GIS/Linear Referenced Format Roadway Functional Class, Speed, Signals, Sidewalks, etc. Land-use/Demographic Data Zoning, Parks, Schools, Mode Split, Transit Stops, etc. Crash Exposure (Count)
Step 2 Compile Data ODOT Plan Data Type Eugene Portland Bend ODOT X X X X X X X X X X X X X X X X X X Ped Counts X X X X Vehicle Counts X X X X X X Zoning Parks Schools Transit Stops X X X X X X X X X X X X Functional Class Ped Facility Bike Facility Trails/Shared-use Paths X X Road Centerlines Road Lanes Road Shoulders X X X X X Road Speed X Traffic Signals Enhanced Crossings Crashes 2007 - 2017 SPIS Data 2009 2015
Step 2 Compile Data Successes/Challenges Successes Robustness of ODOT Data Challenges Not All Data Elements Easily Linked Limited Data for Non-State Roadways Limited Intersection Data Limited Bike/Ped Exposure Data
Step 2 Compile Data Lessons Learned Step 2 Directly Informs Steps 1 and 3 Iterative Process Out-of-State Pedestrian Exposure Models Needed Further Calibration or Re-fitting to Apply to the Oregon Context Crash Data May Contain Multiple Fields That Sometimes Conflict/Provide Different Information Clearly Define Which Crash Data Fields Will Be Used in Analysis
Step 3 Determine Risk Factors Possible Approaches Crash Prediction Models/Safety Performance Functions Research/Local Judgment Crash Frequency-Based
Step 3 Determine Risk Factors ODOT Plan Approach Possible Approaches Crash Prediction Models/Safety Performance Functions Research/Local Judgment Crash Frequency-Based
Step 3 Determine Risk Factors ODOT Plan Results - Pedestrian Risk Factor Facility Type Urban Rural Roadway Characteristics General X X Principal Arterial Segment X X Number of Lanes (>= 4 Lanes) Segment X High-Access Density Segment X No Sidewalks (or Only One Side) Segment X X Posted Speed (>=35 mph) Context General X Mixed Use Zoning General X Other Zoning General X X Proximity to Schools (1 Mile) General X X Proximity to Transit Stops (1/4 Mile) Demographics General X X High Population over the Age of 64 Other Risk Factors (Not Used in Screening Due to Data Availability) Intersection X X High-turning Volumes at Intersections Intersection X X Left-turn Signal Phasing (Permissive) Intersection X X Lighting Intersection/Mid-block X X Propensity for Mid-block Crossings Intersection X X Exposure
Step 3 Determine Risk Factors ODOT Plan Results - Bicycle Risk Factor Facility Type Urban Rural Roadway Characteristics General X X Principal Arterial General X Minor Arterial Segment X X Number of Lanes (>= 4 Lanes) Segment X High-Access Density Segment X No Bike Lanes Segment X X Posted Speed (>=35 mph) Context General X Mixed Use Zoning General X X Proximity to Schools (1 Mile) General X X Proximity to Transit Stops (1/4 Mile) Demographics General X X High Population over the Age of 64 Other Risk Factors (Not Used in Screening Due to Data Availability) Intersection X X High-turning Volumes at Intersections Intersection X X Left-turn Signal Phasing (Permissive) Intersection X X Time of Day/Lighting General X X Scenic Bikeways General X X Exposure
Step 3 Determine Risk Factors Successes Able to Correlate Roadway Characteristics to Crash Risk Identified Risk Factors Supported by Literature Robustness of Geolocated ODOT Crash Dataset Local Data Was Able to Supplement State Data in Large Urban Areas Able to Identify Rural Risk Factors Equivalent Property Damage Only (EPDO) Metric Useful in Prioritizing Factors
Step 3 Determine Risk Factors Challenges Exposure Models From Another State Did Not Produce Useful Results Uncertainty About Blank Entries in Some Data Fields Potential Bias Due to More Data Available in Urban Areas and On State Highways Lack of Comprehensive Coverage for All Desired Data Many Risk Factors Overlap Effort Required to Join Local Agency Data with Statewide Data
Step 3 Determine Risk Factors Lessons Learned Previous Research Can Help Identify Risk Factors When Data is Not Available Pedestrian Exposure Models Developed in One State May Not Be Directly Transferable to Another Early On - Establish Consensus on Approach and Compile Master Database Overall Process is Transferable to Other States/Local Agencies Time/Budget/Approach Will Vary Based on Data Availability Can Focus on Areas with Data and Transfer Results to Areas Without
Step 4 Identify Potential Treatment Sites Evaluate Network for Locations with Risk Factors Basic Count Weighted All Sites w/ a Certain Factor Select Sites Budget, Countermeasure Applicability
Step 4 Identify Potential Treatment Sites ODOT Plan Approach GIS-based Screening Weighted Risk Factors Manual Corridor Review
Step 4 Identify Potential Treatment Sites Successes/Challenges Successes EPDO Scores to Weight Risk Factors Helped In Prioritization GIS-based Screening Analysis Was Efficient Challenges Not All Risk Factors Could be Used in Screening Factors Identified in Literature but for Which Statewide Data Was Not Available
Step 4- Identify Potential Treatment Sites Lessons Learned Using Risk Factors to Segment a Network Can Result in Very Small Segments Sometimes Results in Discontinuous Short High-Scoring Segments Can Aggregate Segments Based on Risk Score or Percentile Groups Could Also Segment Network by Set Amounts and Use Weighted Average Calculations
Step 5 Select Countermeasures Establish a Selection Framework Effectiveness Program/Crash Type Relationship Cost Feasibility Develop Potential Countermeasure List Select Countermeasures
Step 5 Select Potential Countermeasures ODOT Plan Process Review Existing Site Conditions Physical/geometric Conditions Risk Factor Presence Traffic Data Land-use Context Crash History Identify Initial Countermeasure List Assess Feasibility of Initial List
Transferability and Other Considerations and Follow-Up Research
Transferability and Other Considerations Data Availability and Consistency is Critical Some Agencies May Need to Enhance Datasets to Conduct Similar Analyses Existing Research Can Be Used to Fill in Data Gaps Regularly Maintain/Update Data Exposure Models/Data Would Enhance Analyses Syncing Datasets Improves Analysis Efficiency States Could Engage Local Agencies If Plan Will Affect Project and Program Funding Do Not Let Perfect Get in the Way of Good
Follow-up Research More Detailed Analysis at Intersections Developing Flexible Approaches to Estimating Exposure Continue to Expand Understanding of Safety Effects of Treatments


")


![[PDF⚡READ❤ONLINE] Planet Mercury: From Pale Pink Dot to Dynamic World (Springer](/thumb/21549/pdf-read-online-planet-mercury-from-pale-pink-dot-to-dynamic-world-springer.jpg)