Independent Samples T-Test in SPSS for Social Sciences
Learn how to conduct an independent samples t-test in SPSS for Social Sciences, examining differences between two groups on a dependent variable. Understand how to define groups, interpret test results, and calculate effect sizes using Cohen's d.

Download Presentation

Please find below an Image/Link to download the presentation.
The content on the website is provided AS IS for your information and personal use only. It may not be sold, licensed, or shared on other websites without obtaining consent from the author. If you encounter any issues during the download, it is possible that the publisher has removed the file from their server.
You are allowed to download the files provided on this website for personal or commercial use, subject to the condition that they are used lawfully. All files are the property of their respective owners.
The content on the website is provided AS IS for your information and personal use only. It may not be sold, licensed, or shared on other websites without obtaining consent from the author.
E N D
Presentation Transcript
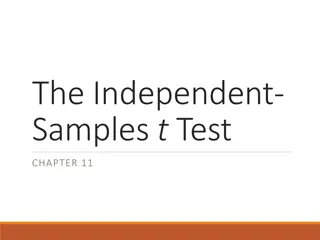
SPSS SPSS Statistical Package for Social Sciences Independent Samples t-test Department of Psychology California State University Northridge www.csun.edu/plunk
Independent samples t Independent samples t- -test Independent samples t-test examines differences between two groups on a dependent variable. test
Independent samples t Independent samples t- -test The test variable is the dependent variable. The grouping variable is the independent variable. Click on define groups test
Independent samples t Independent samples t- -test To define the groups, insert the values for the two groups that are to be compared. Men were coded as 0 while women were coded as 1. test
Independent samples t Independent samples t- -test The values now show in the group variable box test
Independent samples t Independent samples t- -test If the Levene s test is not significant (such as this example), then interpret the top t value. If the Leven s test is significant (p < .05), then interpret the bottom t value test Independent samples t-test indicated no significant difference between women (M = 3.27, SD = 0.54) and men (M = 3.30, SD = 0.53) on hotness, t(3865) = -1.58, p = .11, d = .05. Note 1: I calculated cohen sd using an online calculator such as the one found here http://www.uccs.edu/~lbecker Note 2:The reason the value for SD has a 0 in front of decimal point is that the value could be above 1.00. In the case of p value and dvalue, they can t be above 1.00, so no need to put a 0 before the decimal point.
Independent samples t Independent samples t- -test test This time, put in depress as the test variable; keep gender as the grouping variable.
Independent samples t Independent samples t- -test If the Levene s test is not significant (such as this example), then interpret the top t value.. test Independent samples t-test indicated women (M = 0.89, SD = 0.61) reported significantly higher depressive symptoms than men (M = 0.81, SD = 0.58), t(3665) = -4.06, p < .001, d = 14. Note: When p < .001, it is okay to say p< .001 instead of the actual p value (as recommended by APA). If it was greater than .001, then I would have reported the actual p value (e.g., p < .002 or p < .013)