Innovative Strategies for Clustering Summaries and Evaluations
Explore advanced techniques for summarizing cluster contents and evaluating clustering results. Enhance clustering analysis by comparing cluster distributions, calculating interestingness scores, and utilizing decision trees for cluster separation. Dive into methods like box plots and evaluation measures to gain deeper insights.

Download Presentation

Please find below an Image/Link to download the presentation.
The content on the website is provided AS IS for your information and personal use only. It may not be sold, licensed, or shared on other websites without obtaining consent from the author. If you encounter any issues during the download, it is possible that the publisher has removed the file from their server.
You are allowed to download the files provided on this website for personal or commercial use, subject to the condition that they are used lawfully. All files are the property of their respective owners.
The content on the website is provided AS IS for your information and personal use only. It may not be sold, licensed, or shared on other websites without obtaining consent from the author.
E N D
Presentation Transcript
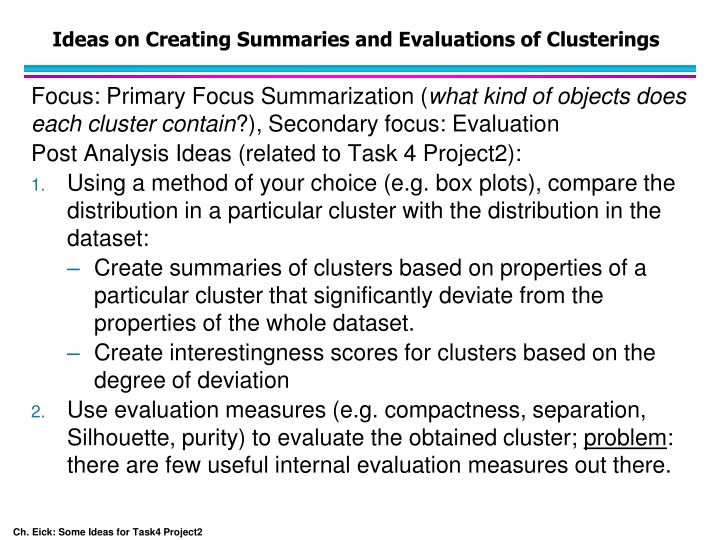
Ideas on Creating Summaries and Evaluations of Clusterings Focus: Primary Focus Summarization (what kind of objects does each cluster contain?), Secondary focus: Evaluation Post Analysis Ideas (related to Task 4 Project2): 1. Using a method of your choice (e.g. box plots), compare the distribution in a particular cluster with the distribution in the dataset: Create summaries of clusters based on properties of a particular cluster that significantly deviate from the properties of the whole dataset. Create interestingness scores for clusters based on the degree of deviation 2. Use evaluation measures (e.g. compactness, separation, Silhouette, purity) to evaluate the obtained cluster; problem: there are few useful internal evaluation measures out there. Ch. Eick: Some Ideas for Task4 Project2
Ideas on Creating Summaries and Evaluations of Clusterings II More Post Analysis Ideas: 3.Learn a decision tree (some other model) that separates the instances of a particular cluster from the instances of the other 4 clusters Use the accuracy of the decision tree as a measure for the quality of a cluster Use a highly pruned version of the decision tree as a summary of the decision tree (or rules derived from a decision tree; e.g. report all paths that lead to choose the class of cluster as a set of rules) 4.Using a method of your choice (e.g. box plots), compare the distribution of pairs of clusters: Analyze which clusters are similar to each other and which deviate from each other. Summarize the patterns they have in common and the patterns in which they differ. 5. Ch. Eick: Some Ideas for Task4 Project2
Example1: Using Box Plot Cluster Summaries Compute the interquartile range (IQR) for each attribute for the dataset and for each cluster. Compute the overlap of each cluster box plot with the dataset boxplot. Let (a,b) be the cluster IQR with a>b and (a ,b ) the dataset IQR with a >b for attribute att; then: att=max(0, min(a ,a)-max(b ,b)) / (max(a ,a)-min(b ,b))) Discard cluster box plot for att if att>th (e.g. th=0.7) Use the surviving boxplots as cluster summary for the clusters also reporting for all clusters (including the discarded ones) Compute cluster interestingness as follows: Let O= { 1, , r} be the overlap of a cluster c for its r attributes; in in general, Interestingness(c)=f(O); e.g. f(O)=average(O.values) Let v1, v2, v3 the lowest, second lowest, and third lowest value in O: Interestingness(O)=1- ((v1*3+v2*2+v3*1)/6) 1. 2. 3. 4. 5. Ch. Eick: Some Ideas for Task4 Project2